 sonar
sonar
What an ASO Analysis Actually Covers (and Why Most Are Incomplete)
An ASO analysis is a structured evaluation of every factor that affects how your app ranks in store search results and converts impressions into installs. It goes beyond checking your title length. A thorough analysis audits metadata, keyword positioning, competitor strength, conversion assets, ratings, and cross-platform differences — then prioritizes what to fix first.
Most developers stop at metadata. They check their title, glance at their description, and move on. That covers maybe 30% of the picture. The remaining 70% — keyword gap analysis, competitor benchmarking, conversion rate review, ranking trend tracking — is where the actual leverage sits. In my experience building Sonar and reviewing hundreds of listings, the apps that gain the most ground run a full-scope ASO analysis on a regular cadence, not a one-time title tweak.
This guide walks through each layer with real data from Sonar's API.
Step 1: Metadata Audit — Title, Subtitle, Description, Keywords
The metadata audit is the foundation of any ASO analysis. Apple's App Store indexes the title (30 characters), subtitle (30 characters), and a 100-character keyword field. Google Play indexes the title (30 characters), short description (80 characters), and the full long description (up to 4,000 characters) (source: Apple App Store Connect Help; Google Play Console Help).
A metadata audit checks each field against three criteria:
- Character usage — Are you using the available space, or leaving value on the table?
- Keyword inclusion — Do your highest-priority keywords appear in the indexed fields?
- Redundancy — Are you repeating words across title and subtitle (wasting indexable space)?
What a Metadata Audit Looks Like in Practice
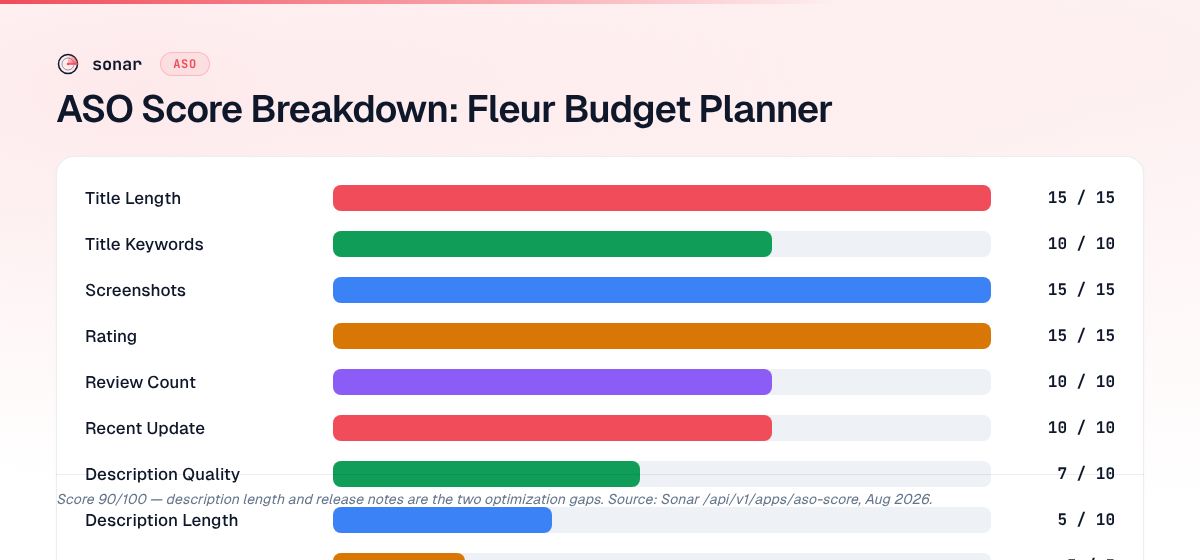
Sonar's ASO score tool rates Fleur - Budget Planner App at 90/100, with full marks on title length (15/15), title keywords (10/10), screenshots (15/15), and rating (15/15), but flags description length (5/10) and release notes (3/5) as optimization gaps — exactly the kind of check-by-check audit an ASO analysis should surface (source: Sonar /api/v1/apps/aso-score, queried 2026-08-22).
That 90/100 score sounds strong, but the breakdown reveals two specific weaknesses. The description scored 5 out of 10 — Sonar flagged it as too short, recommending 1,000+ characters with feature details. The release notes scored 3 out of 5, marked as too brief. Every other check passed with full marks.
Here is the full breakdown:
| Check | Score | Max | Status |
|---|---|---|---|
| Title Length | 15 | 15 | Good |
| Title Keywords | 10 | 10 | Good |
| Description Length | 5 | 10 | Needs work |
| Description Quality | 7 | 10 | Good |
| Screenshots | 15 | 15 | Good |
| Rating | 15 | 15 | Good |
| Review Count | 10 | 10 | Good |
| Recent Update | 10 | 10 | Good |
| Release Notes | 3 | 5 | Needs work |
This is the kind of structured output that makes a metadata audit actionable. Instead of a vague "your listing needs improvement," you get a prioritized list. Fleur's team should expand their description and write more detailed release notes — everything else is already optimized. For a deeper walkthrough of each metadata field and how indexing works, see our practical guide to app store metadata optimization.
Step 2: Keyword Gap Analysis
A keyword gap analysis identifies search terms where you should rank but don't — or where competitors rank and you're absent. This is the highest-ROI step in most ASO analyses because it reveals immediate opportunities without changing your product.
The process works in three stages:
- Pull your current keyword rankings for all terms you're targeting.
- Pull competitor keyword rankings for the same terms plus their unique terms.
- Identify the gaps — keywords where competitors rank in the top 10 and you don't rank at all.
Understanding Keyword Difficulty Before Targeting Gaps
Not every gap is worth closing. Keyword difficulty tells you whether ranking for a term is realistic given your app's current authority. Sonar's keyword index puts "budget planner" at iOS difficulty 64 with an Apple popularity score of 51, while Android difficulty sits at 63 — near-parity that tells you both platforms are highly competitive (source: Sonar /api/v1/keywords/search, queried 2026-08-22).
For "habit tracker," Sonar reports iOS difficulty 64 and popularity 58, versus Android difficulty 62 — another high-competition keyword where cross-platform gap analysis reveals minimal strategic differentiation opportunity (source: Sonar /api/v1/keywords/search, queried 2026-08-22).
| Keyword | iOS Difficulty | iOS Popularity | Android Difficulty |
|---|---|---|---|
| budget planner | 64 | 51 | 63 |
| habit tracker | 64 | 58 | 62 |
Both keywords show difficulty scores above 60 on both platforms, which means the top 10 results are dominated by apps with strong download histories and high ratings. If your app is new or has fewer than 1,000 reviews, a smarter move is targeting low-competition long-tail keywords that still carry meaningful search volume. "Budget planner" might be the obvious target, but "travel budget planner" sits at iOS difficulty 31 — a fraction of the competition with a realistic path to page one (source: Sonar /api/v1/keywords/search, queried 2026-08-22).
For a complete workflow on finding and prioritizing keywords, see our 6-step keyword research guide. To understand what the difficulty score actually measures, read keyword difficulty explained.
Step 3: Competitor Benchmarking
Competitor benchmarking goes beyond keyword overlap. A proper ASO analysis compares your listing against your top 3-5 competitors across every dimension: metadata quality, visual assets, ratings, update frequency, and keyword coverage.
Here is the framework I use when benchmarking competitors in Sonar:
| Dimension | What to Compare | Why It Matters |
|---|---|---|
| Title & subtitle | Keyword overlap, brand positioning | Reveals shared and unique keywords |
| Description | Length, keyword density, structure | Google Play description affects rankings directly |
| Screenshots | Count, style, messaging | Biggest conversion factor in browse results |
| Ratings | Score and volume | Ratings influence rankings algorithmically |
| Update recency | Date of last update | Both stores favor actively maintained apps |
| Keyword coverage | Terms ranked in top 10 | Identifies your competitive gaps |
Running a Side-by-Side ASO Score Comparison
Sonar's ASO score tool lets you compare apps on the same rubric. Take two budget planner apps: Fleur scores 90/100 while Buddy: Budget Planner App scores 93/100 (source: Sonar /api/v1/apps/aso-score, queried 2026-08-22). The 3-point difference comes from specific areas — Buddy scores higher on description length (8/10 vs. 5/10) and release notes (5/5 vs. 3/5), but lower on description quality (5/10 vs. 7/10).
That granularity tells you exactly where a competitor is outperforming you and where they're vulnerable. Fleur's description is better written but too short. Buddy's is longer but poorly structured. You can run this comparison for any app using Sonar's free ASO score tool.
For a deeper dive into spying on competitor keyword strategies, see our guide on competitor keyword analysis.
Step 4: Conversion Asset Review
Keywords bring impressions; conversion assets turn impressions into installs. An ASO analysis that ignores screenshots, icons, and preview videos is leaving the most actionable lever untouched.
Apple's App Store shows up to 10 screenshots per locale, and the first three are visible without scrolling in search results (source: Apple Developer Documentation). Google Play shows up to 8 screenshots, with the first 2-3 visible in search. These visible screenshots are your headline — they need to communicate your app's core value in under 2 seconds.
What to Audit in Your Visual Assets
- Screenshot count — Are you using all available slots? Both Fleur and Buddy scored 15/15 on Sonar's screenshot check (source: Sonar /api/v1/apps/aso-score, queried 2026-08-22), meaning they use the full allotment.
- First-screenshot messaging — Does it communicate the primary use case or feature?
- Caption text — Are your screenshots captioned with benefit-driven text, not feature names?
- Icon distinctiveness — Does your icon stand out in a crowded search results grid?
- Preview video — If you have one, does it autoplay well (silent, captioned)?
The conversion side of ASO analysis is often where the biggest gains hide. I have seen apps improve conversion rates by 20-40% from screenshot redesigns alone, with no metadata changes. If you have never A/B tested your screenshots, that should be near the top of your ASO analysis action items.
Step 5: Ratings and Review Analysis
Your app's rating directly affects both rankings and conversion. Apple's search algorithm weights ratings as a ranking signal, and users filter by minimum star rating when browsing (source: Apple Developer Documentation — Ratings, Reviews, and Responses). Google Play's algorithm similarly uses rating quality and velocity.
An ASO analysis should evaluate three rating dimensions:
- Current rating — Is it above 4.0? Below 4.0, conversion drops sharply. Both Fleur and Buddy scored 15/15 on Sonar's rating check (source: Sonar /api/v1/apps/aso-score, queried 2026-08-22).
- Review volume — A 4.8-star rating based on 12 reviews carries far less weight than a 4.5 with 5,000 reviews. The stores factor volume into ranking confidence.
- Recent review sentiment — Are your latest reviews trending positive or negative? A sudden spike in 1-star reviews signals a bug that will hurt rankings before you notice the organic traffic drop.
Reading your competitors' negative reviews surfaces feature gaps and pain points you can address in your own metadata.
Step 6: Ranking Tracking Over Time
A single snapshot tells you where you stand today. Ongoing keyword rank tracking tells you whether your changes are working.
After running an ASO analysis and implementing changes, track your target keywords daily for at least 2-4 weeks. Apple's algorithm typically reflects metadata changes within 24-72 hours, while Google Play can take 1-2 weeks (source: Google Play Console Help — Optimize your store listing). If you don't see movement after that window, the keyword may require stronger signals — more downloads, better ratings, or a different keyword strategy entirely.
What to track:
- Rank position for your top 10-20 target keywords
- Rank trends — improving, stable, or declining over 30/60/90 days
- Competitor rank shifts — are competitors gaining on the same terms?
- New keyword entries — terms where you've entered the top 50 for the first time
Change one variable at a time — title first, then subtitle, then keyword field — and track rankings between each change so you know which edit moved the needle.
Step 7: Cross-Platform Differences
If your app is on both iOS and Google Play, your ASO analysis must account for platform-specific indexing rules. The two stores index different fields, weight signals differently, and update rankings on different timelines.
| Factor | iOS App Store | Google Play |
|---|---|---|
| Indexed fields | Title, subtitle, keyword field | Title, short description, long description |
| Keyword field | 100 characters (hidden) | No separate field — all in metadata text |
| Description indexing | Not indexed for search | Fully indexed (4,000 characters) |
| Update impact speed | 24-72 hours | 1-2 weeks |
| Rating weight | High | High |
| Download velocity weight | High (especially first 72 hours) | High |
This cross-platform gap is where many ASO analyses fall short. An app perfectly optimized for iOS might rank poorly on Google Play if the long description isn't keyword-optimized — because that field doesn't matter on iOS but matters significantly on Android (source: Google Play Console Help). For a full breakdown of these differences, see iOS vs Google Play: how ASO differs.
The Sonar keyword data above illustrates this: "budget planner" shows iOS difficulty 64 vs. Android difficulty 63, near-parity on that specific term. But parity on difficulty doesn't mean parity on strategy. The optimization levers available to you are fundamentally different on each platform.
How Often Should You Run an ASO Analysis?
A full ASO analysis should run quarterly at minimum, with lightweight keyword tracking happening weekly or daily. Major triggers for an off-cycle analysis include:
- A significant ranking drop (more than 5 positions on a primary keyword)
- A new competitor entering your category
- A store algorithm update — Apple and Google both make periodic changes to ranking algorithms
- A product update that changes your core value proposition
- Expansion to a new locale or market
The stores are dynamic — a keyword at difficulty 31 last quarter might be 50 this quarter if a well-funded competitor entered the space. Your ASO KPIs should include ranking position, keyword coverage breadth, and conversion rate, tracked over time.
Frequently Asked Questions
What is an ASO analysis?
An ASO analysis is a structured audit of your app store listing that evaluates metadata (title, subtitle, description, keywords), keyword rankings, competitor positioning, conversion assets (screenshots, icon, ratings), and cross-platform performance. The goal is to identify specific weaknesses that limit your search visibility and install conversion rate, then prioritize fixes by expected impact.
How long does an ASO analysis take?
A first-time comprehensive ASO analysis typically takes 2-4 hours, covering metadata review, keyword gap analysis, competitor benchmarking, and conversion asset evaluation. Subsequent analyses are faster (1-2 hours) because you already have baseline data. Tools like Sonar's ASO score reduce the metadata audit portion to minutes by scoring each element on a standardized rubric (source: Sonar /api/v1/apps/aso-score).
What tools do I need for an ASO analysis?
At minimum, you need a keyword research tool that shows difficulty and popularity scores, a rank tracking tool, and access to your store analytics (App Store Connect or Google Play Console). Sonar combines keyword research, difficulty scoring, and ASO scoring in one platform. For a full comparison of available options, see our best ASO tools roundup.
How is ASO analysis different from an ASO audit?
The terms overlap significantly. An "ASO audit" typically refers to a one-time evaluation of your current listing — a snapshot. An "ASO analysis" often implies a broader, ongoing practice that includes the audit plus keyword gap analysis, competitor benchmarking, ranking trend tracking, and cross-platform comparison. In practice, any thorough ASO audit should include these analytical layers. Our ASO audit guide walks through the listing-level checks in detail.
Should I run a separate ASO analysis for iOS and Android?
Yes. iOS and Google Play index different metadata fields, weight ranking signals differently, and update at different speeds. An app optimized for iOS may underperform on Google Play if the long description (4,000 characters, fully indexed) isn't keyword-structured. Run each platform's analysis independently, then compare results to find cross-platform strategy gaps (source: Apple App Store Connect Help; Google Play Console Help).
Want to run your own ASO analysis with real keyword data? Try Sonar free — it shows difficulty, popularity, and competitor data for every keyword, plus an instant ASO score for any app.