sonar
The 100th app on the US App Store's Health & Fitness top-grossing chart is not a small business by indie standards. Sonar's model puts the median app at positions 51–100 of that chart at about $69K a month. But the median subscription app in RevenueCat's 2026 report earns about $72 a month in its first year (RevenueCat, State of Subscription Apps 2026). That is a gap of roughly 1,000×, and it is the honest answer to "how much do apps make": it depends almost entirely on where in the distribution you sit, and almost everyone sits at the bottom.
By Peter, founder of Sonar. Sonar API data pulled November 20, 2026 (US storefront, top-grossing charts). Every Sonar figure below is a model estimate, not reported revenue.
How much do apps make? The short answer
How much apps make depends on chart position far more than on category. In Sonar's November 20, 2026 estimates for the US top-grossing charts, the median app ranked #1–10 makes about $15.2M a month on the overall iPhone chart, the median app at #51–100 about $1.2M, and in a mid-sized category like Health & Fitness the #51–100 median falls to about $69K a month.
Below the charts, the typical app makes close to nothing. RevenueCat's 2026 report, built on more than 115,000 apps and over $16 billion in revenue, found that the median subscription app earns about $72 a month in its first year and the top 10% earn $2,574 or more (RevenueCat). Only 17.3% of newly launched apps reach $1K in monthly revenue within two years, and only 4.6% reach $10K (same source).
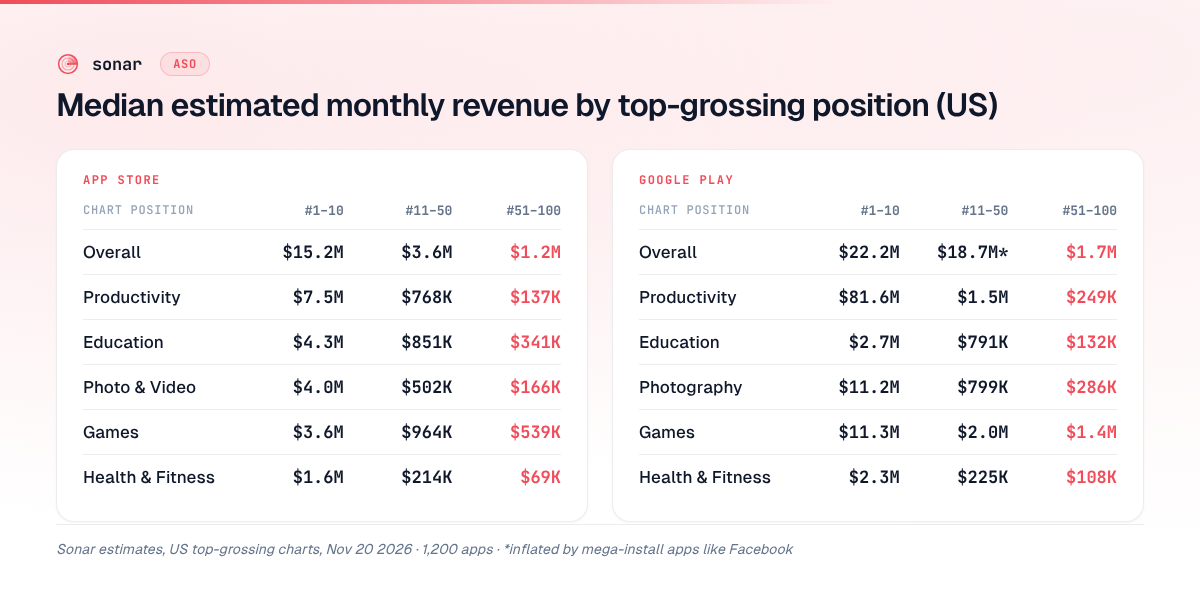
Estimated revenue by chart position (Sonar data, November 2026)
The table below shows the median estimated monthly revenue for apps in three bands of each US top-grossing chart, plus the median estimated revenue per install. Twelve charts, 100 apps each, 1,200 entries in total, pulled through Sonar's chart and revenue endpoints on November 20, 2026. (For week-to-week chart movement, see the App Store trends report.)
| Chart (US, top grossing) | Median #1–10 | Median #11–50 | Median #51–100 | Median monthly revenue per install |
|---|---|---|---|---|
| iOS overall | $15.2M | $3.6M | $1.2M | $0.024 |
| iOS Health & Fitness | $1.6M | $214K | $69K | $0.028 |
| iOS Productivity | $7.5M | $768K | $137K | $0.055 |
| iOS Photo & Video | $4.0M | $502K | $166K | $0.035 |
| iOS Education | $4.3M | $851K | $341K | $0.058 |
| iOS Games | $3.6M | $964K | $539K | $0.031 |
| Android overall | $22.2M | $18.7M | $1.7M | $0.046 |
| Android Health & Fitness | $2.3M | $225K | $108K | $0.036 |
| Android Productivity | $81.6M | $1.5M | $249K | $0.049 |
| Android Photography | $11.2M | $799K | $286K | $0.048 |
| Android Education | $2.7M | $791K | $132K | $0.068 |
| Android Games | $11.3M | $2.0M | $1.4M | $0.051 |
Source: Sonar /api/v1/charts/top and /api/v1/apps/revenue, US storefront, top-grossing charts, measured 2026-11-20. All values are model estimates in USD per month.
How the estimates were made
Each estimate is an install base multiplied by category monetization benchmarks. On iOS, Apple publishes no install counts, so the install base is derived from the app's US rating count times a category installs-per-rating ratio; Sonar grades those estimates medium or low confidence. On Android, the install base is Google Play's public install count, graded high confidence for the install base only. The monetization side is a category benchmark on both stores. How this kind of model is built, and how badly it can miss, is covered in how app revenue estimates work and fail; I won't repeat it here.
Two caveats matter for reading the table:
- The estimates order apps only loosely. The real grossing chart is ranked by actual revenue. The Spearman correlation between chart position and Sonar's estimate runs from 0.36 (iOS and Android games) to 0.65 (iOS Productivity). That correlation is Sonar's own computation: chart position against Sonar's estimate across each chart's 100 entries. That is why the table shows band medians, not single-app numbers.
- Single-app ranges are wide. MyFitnessPal, #1 on iOS Health & Fitness, is estimated at about $4.0M a month, with a range of $599K to $20M because installs per rating vary several-fold between apps.
The model also fails loudly in places. On the Android overall chart, Facebook sits at #30 with 12.2 billion installs, and scaling that install count by benchmarks produces about $27.5 billion a month: an impossible figure. Band medians are robust to outliers like that; averages are not. Even so, the Android overall #11–50 median ($18.7M) is inflated by mega-install apps like Facebook that sit in that band, which is why it barely drops from the #1–10 median.
What the chart data says about app revenue
Revenue falls off a cliff inside the top 100
In every one of the 12 charts, the median falls steeply from positions 1–10 to positions 51–100. On iOS overall the band medians go $15.2M, $3.6M, $1.2M a month. On iOS Health & Fitness they go $1.6M, $214K, $69K: the bottom half of the category top 100 earns roughly 4% of what the top 10 earns at the median.
The drop between #1 and #10 is often bigger still. On iOS Productivity, ChatGPT at #1 is estimated at about $182.7M a month and Yahoo Mail at #10 at about $1.75M. On iOS Health & Fitness, MyFitnessPal at #1 is about $4.0M and Hume Health at #10 about $311K (Sonar estimates, November 20, 2026).
What it takes to sit at #100 in a category
Making the top 100 of a category chart is not the same as making serious money, which is where the answer to "how much do apps make" gets uncomfortable. On iOS Health & Fitness, the lowest estimate among positions 51–100 is about $2K a month, and four apps on that chart are estimated under $5K a month. On Android Photography, seven are under $5K. Category charts are thin enough at the bottom that a modest app can appear on them; the overall chart is not, and its #51–100 median is still about $1.2M on iOS.
Health & Fitness vs Productivity
Productivity is a far bigger pool at the top. The iOS Productivity #1–10 median ($7.5M) is nearly five times the Health & Fitness median ($1.6M), with ChatGPT alone estimated at about $182.7M a month at #1. By positions 51–100 the gap narrows to about 2× ($137K vs $69K).
iOS vs Android
Don't read the Android-vs-iOS gap in this table as a store difference. Android estimates scale Google Play's public install count, which isn't limited to the US, while iOS estimates start from US ratings only. That method difference likely explains much of numbers like the Android Productivity top-10 median of $81.6M. Compare bands within a store, not across stores.
Games
Games compress. On iOS, the games #51–100 median ($539K) is the second-highest bottom band after the overall chart, while its #1–10 median ($3.6M) is one of the lower top bands. Games are also where Sonar's estimates agree least with the real chart order (Spearman 0.36 on both stores), likely because consumable-purchase spending varies wildly between titles with similar audiences. Which monetization model the top grossers actually use is broken down in app monetization models compared.
Why the typical app makes close to nothing
The typical app makes close to nothing because revenue is concentrated in a few hundred titles out of roughly two million. Apple's 2024 App Store Transparency Report counted 1,961,596 apps on the App Store at the end of 2024 (Apple). Each category's top-grossing chart in the data above holds 100 of them.
RevenueCat's measured data shows the same shape from the other end. The median subscription app makes about $72 a month in its first year, the top 10% make $2,574 or more, a 36× gap, and the top 25% of apps grew 80% year over year while the bottom 25% shrank by 33% (RevenueCat, State of Subscription Apps 2026). RevenueCat only sees apps with subscriptions integrated, so apps with no monetization aren't in that median.
The root cause is distribution, not pricing. An app earns from people who find it, and most new apps don't rank anywhere people search. How to estimate your own search ceiling is covered in how many downloads a new app should get.
Store fees on small revenue
At small scale the stores take 15%, not 30%. Apple's App Store Small Business Program charges a reduced 15% commission to developers who made up to $1 million in proceeds in the prior calendar year, and to new developers (Apple Developer). In the US, Google Play's fee structure effective June 30, 2026 charges 10% plus a 5% billing fee (15% in total) on auto-renewing subscriptions, for new and existing installs alike. Other purchases pay the same 10% + 5% on the first $1M of annual earnings when they come from new installs (users who first installed or first updated the app on or after the rollout date), and 20% + 5% when they come from existing installs (Google Play Console Help). So for a subscription app, the median $72 a month leaves about $61 after a 15% cut on either store, before taxes.
How much money do apps make per download?
Per download, apps make cents, not dollars, once you count every past install. Sonar's median estimated monthly revenue per install across the 12 top-grossing charts ranges from about $0.02 (iOS overall, $0.024) to about $0.07 (Android Education, $0.068), measured November 20, 2026. That divides monthly revenue by the app's entire install base, most of which no longer opens the app.
Measured per new install, the number is higher. RevenueCat reports a median revenue per install of $0.38 at day 14 and $0.55 at day 60 for North American installs of subscription apps, versus $0.23 and $0.34 globally (RevenueCat). The two figures answer different questions:
| Metric | Value | What it measures |
|---|---|---|
| Revenue per install, lifetime base (Sonar estimate) | about $0.02–$0.07 per month | Current monthly revenue ÷ every install ever |
| Revenue per new install, day 60 (RevenueCat, North America) | $0.55 | Cumulative revenue from a fresh install over 60 days |
For planning, use the second: if a new install is worth about $0.50 in its first two months, 1,000 downloads a month buys you roughly $500 of revenue at the median, and getting that 1,000 is the hard part.
How much do apps make from ads?
Sonar has no ad-revenue data, so nothing in the chart table measures advertising. What is public is the eCPM, the revenue an app earns per 1,000 ad impressions, and the arithmetic is simple: revenue = impressions ÷ 1,000 × eCPM.
The benchmark: Tenjin and Clever Ads Solutions' 2024 benchmark report put average US iOS eCPMs at $19.62 for interstitial ads and $27.88 for rewarded ads in mobile games in Q1 2024 (Pocket Gamer.biz, June 5, 2024). Those are game averages for the highest-paying market and platform; non-game apps, banners, Android and other countries all run lower.
A worked example with that interstitial figure:
| Daily active users | Interstitials per user per day | Impressions per month (30 days) | Revenue per month at $19.62 eCPM |
|---|---|---|---|
| 500 | 2 | 30,000 | about $589 |
| 5,000 | 2 | 300,000 | about $5,886 |
| 50,000 | 2 | 3,000,000 | about $58,860 |
That assumes full fill and all-US iOS users, so treat it as a ceiling. The lesson is that ad revenue scales with daily active users, not downloads: an app with 10,000 downloads and 300 daily users earns ads on the 300. At the ecosystem level ads are large, with Apple's commissioned study counting $151 billion in in-app advertising across the App Store ecosystem in 2025 (Apple Newsroom, June 2026), but that money follows the same concentration as purchases.
What this means for your app
The useful question isn't "how much do apps make on average?" It's which band you can realistically reach and what that band pays. Three takeaways from the data:
- The bottom of a category top 100 is a real business. At about $69K a month (iOS Health & Fitness, #51–100 median estimate), it beats the median app by roughly 1,000×.
- Getting there is a distribution problem. Revenue per install is cents a month across the installed base, so revenue tracks how many people find you, which on the App Store means ranking for keywords people actually search.
- Benchmark against competitors, not averages. Look up the apps directly above you in your category chart and their estimated revenue ranges, then work out what install volume closes the gap.
FAQ
How much do apps make on average?
The average is misleading because a few apps earn most of the money. The median subscription app earns about $72 a month in its first year, while the top 10% earn $2,574 or more (RevenueCat, 2026). Apps in a category's top-grossing top 10 are estimated in the millions per month (Sonar, November 20, 2026).
How much do mobile apps make at #100 on the charts?
On the US iPhone top-grossing chart, Sonar's median estimate for positions 51–100 is about $1.2M a month. In a single category it is much lower: about $69K for Health & Fitness and $137K for Productivity on iOS (estimates, November 20, 2026).
How much money do apps make per download?
Measured against all past installs, Sonar estimates top-grossing apps make about $0.02 to $0.07 per install per month. Per new install, RevenueCat reports a median of $0.55 by day 60 for North American subscription app installs. Use the per-new-install figure to plan acquisition.
How much do apps make from ads?
Revenue equals impressions divided by 1,000 times the eCPM. At the US iOS game interstitial average of $19.62 (Tenjin and CAS, Q1 2024), 5,000 daily users seeing two ads a day earn about $5,900 a month at full fill. Sonar has no ad-revenue data of its own.
Are app revenue estimates accurate?
They are directionally useful and individually unreliable, so treat any answer to "how much do apps make" as a band, not a figure. Sonar's estimates match the real grossing order only loosely (Spearman 0.36–0.65 across the 12 charts), and single-app ranges span roughly 30× on iOS. Use band medians and ranges, and read how app revenue estimates work and fail before quoting any single number.
Want to see the estimated revenue range for a competitor or your own category? Look any app up in Sonar, or compare plans to track the charts and keywords that decide which band you land in.