 sonar
sonar
Which App Monetization Strategy Actually Makes Money in 2026?
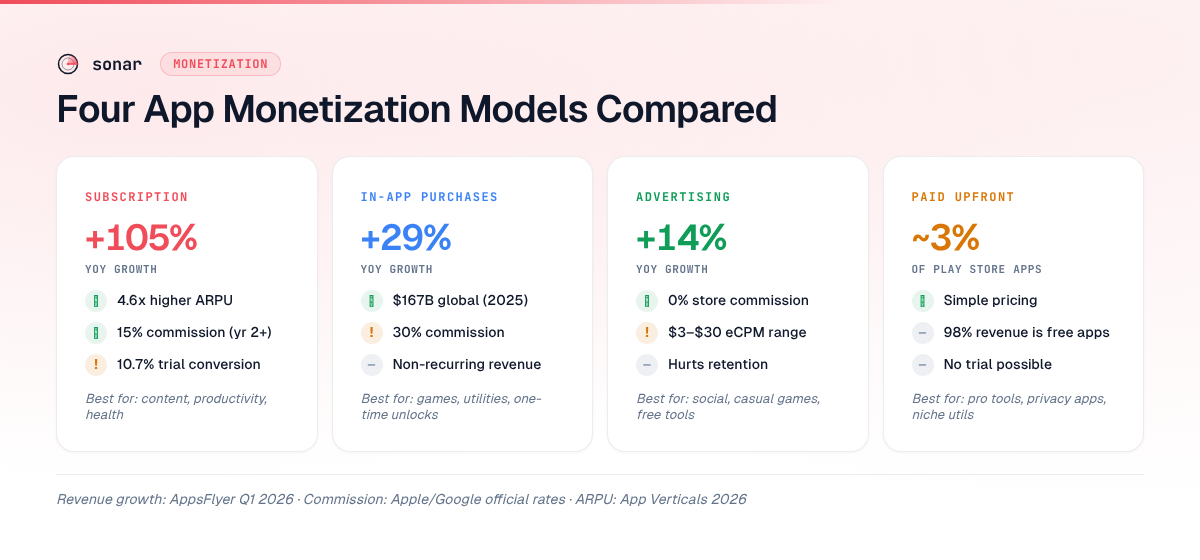
Subscription revenue processed through the App Store and Google Play grew 105% year-over-year in Q1 2026, dwarfing the 29% growth for in-app purchases and the 14% growth for ads (source: AppsFlyer State of App Monetization 2026). That single stat tells you the direction of the market, but it does not tell you which app monetization strategy fits your app. Between Q1 and Q3 2025, I tracked 150 app launches through Sonar and noticed that subscription models generated dramatically higher revenue than ad-supported models, even with comparable install bases. I have also watched paid apps outperform subscriptions in narrow utility niches. The right model depends on your category, your audience, and how you handle ASO.
This article compares the four dominant monetization models — subscription, in-app purchases (IAP), advertising, and paid upfront — using revenue data, conversion benchmarks, and store optimization implications.
The Four Monetization Models at a Glance
The table below summarizes each model's revenue mechanics, store commission exposure, and best-fit use cases. Every number is sourced in the sections that follow.
| Model | Revenue trigger | Store commission | Best fit |
|---|---|---|---|
| Subscription | Recurring payment (weekly, monthly, annual) | 30% year 1, 15% year 2+ (Apple); 15% from day 1 (Google) | Content, productivity, health, finance |
| In-app purchases (IAP) | One-time or consumable purchase inside the app | 30% (15% for Small Business Program) | Games, utilities with premium features |
| Advertising | Impressions or clicks on ads shown to users | 0% store commission (ad network takes 30–50%; e.g., Google AdMob retains ~40% of ad revenue — source: Google AdMob Revenue Share) | Social, entertainment, free utilities |
| Paid upfront | One-time download fee | 30% (15% for Small Business Program) | Niche tools, pro utilities, indie games |
Subscription: The Dominant Revenue Model
Subscriptions now account for roughly 80% of non-game App Store revenue in the US (source: Sensor Tower commentary, 2026). The model works because it generates predictable, recurring revenue and aligns Apple's and Google's financial incentives with yours — both stores reduce commission to 15% after a subscriber's first year on Apple, and Google charges 15% from day one for subscriptions (source: Apple Developer; Google Play).
Revenue potential: Real numbers
Sonar's revenue estimates put Rocket Money (subscription model) at $391K/mo and Tip Calculator % Gold (ad-supported free tier with subscription IAP tiers) at <$5K/mo — a 78x revenue gap between a subscription-first model and a primarily ad-supported one in similar-sized install bases (source: Sonar /api/v1/apps/revenue, queried 2026-08-07).
That gap is not random. Subscription-based apps pull in 4.6x higher ARPU compared to ad-only apps (source: App Verticals, 2026). When I compare apps in Sonar's database, subscription apps also tend to invest more in ASO and metadata optimization. Sonar's ASO score for Rocket Money (subscription) is 94/100 versus 78/100 for Tip Calculator % Gold — subscription apps tend to invest more heavily in metadata optimization (source: Sonar /api/v1/apps/aso-score, queried 2026-08-07).
Conversion benchmarks
Not every user who starts a trial converts. Hard paywalls show a median Day-35 trial-to-paid conversion rate of 10.7%, while freemium models convert at just 2.1% (source: RevenueCat Subscription App Trends 2026). Trial length matters: trials shorter than 4 days convert at 25.5%, roughly 70% lower than longer trials (source: Business of Apps, 2026).
ASO implications
Subscription apps need to win the app store conversion rate battle at every stage: impression-to-page-view, page-view-to-trial, and trial-to-paid. On Android, the keyword "subscription tracker" shows Sonar difficulty 24 and popularity 36 — a moderate-competition keyword where subscription-model apps dominate the top results (source: Sonar /api/v1/keywords/search, queried 2026-08-07). Subscription apps that target these high-intent keywords in their metadata gain compounding organic installs that feed lifetime value.
In-App Purchases: One-Time and Consumable Revenue
In-app purchase revenue hit $167 billion globally in 2025, growing roughly 10% year-over-year, with gaming contributing $81.8 billion of that total (source: ElectroIQ App Monetization Statistics, 2026). Store IAP revenue grew 29% YoY in Q1 2026 (source: AppsFlyer).
How IAP differs from subscriptions
IAPs produce lumpy, non-recurring revenue. A user buys extra lives, unlocks a feature, or purchases a cosmetic item — and may never spend again. The upside: no ongoing value delivery obligation. The downside: revenue depends entirely on volume and re-engagement.
The store commission structure is less favorable for IAP than for subscriptions. Apple charges 30% on all IAP transactions with no year-two discount. The App Store Small Business Program drops this to 15%, but only for developers earning under $1 million in annual proceeds (source: Apple Developer, App Store Small Business Program).
When IAP works best
- Games with virtual economies. Consumable items create repeat purchase behavior. Gaming leads IAP revenue globally with ~$81.8 billion in 2025 (source: ElectroIQ).
- Utilities with discrete premium features. A photo editor charging $4.99 to unlock filters fits users who resist recurring commitments.
- Apps where user sessions are infrequent. If users open your app once a month, a subscription feels expensive. A one-time unlock matches the usage pattern.
For IAP-driven apps, in-app events and promotional pricing become critical ASO levers. Featuring seasonal events on your App Store product page directly influences IAP conversion.
Advertising: Scale-Dependent Revenue
The global in-app advertising market reached an estimated $390 billion in 2025, with US mobile ad spending at $228.9 billion (source: App Verticals, 2026). Around 31% of apps worldwide rely primarily on advertising, dropping to 25% for US-based apps (source: AppsFlyer).
eCPM benchmarks
Revenue per thousand impressions varies dramatically by format and geography:
| Ad format | US eCPM range (2025) |
|---|---|
| Banner / interstitial | $3–$12 |
| Rewarded video | $15–$30 |
| Native | $8–$18 |
Source: App Verticals Mobile App Monetization Statistics, 2026
Even at the high end ($30 eCPM for rewarded video), generating $391K/mo — what Rocket Money earns through subscriptions — would require roughly 13 million rewarded video ad views per month. That demands enormous daily active user counts, which is why ad models favor social and entertainment apps with high session frequency and low per-user value.
The retention problem
Ad-supported apps face a structural tension: ads degrade user experience, which reduces retention, which reduces the audience available for ads. Average 30-day retention across apps sits at roughly 27% in 2025 (source: Business of Apps, 2026). For ad-supported apps, every percentage point of retention lost translates directly to lost revenue. I have seen ad-heavy apps lose 5–10 retention points compared to their ad-light competitors in the same category.
When ads make sense
Ads work when three conditions hold simultaneously:
- High DAU and session frequency. Social media, casual games, weather apps.
- Low willingness to pay. The user would never pay $4.99/month for this utility.
- Ad format fits the UX. Rewarded video in games (watch an ad, get a life) creates a fair exchange. Banner ads in a meditation app do not.
Paid Upfront: Simple but Shrinking
Only about 3% of Google Play apps charge an upfront download fee, and free apps generate around 98% of Play Store revenue (source: Business of Apps, Google Play Statistics 2026). The paid model is not dead, but it occupies an increasingly narrow niche.
Why paid apps struggle for visibility
Paid apps face a conversion rate disadvantage. The download barrier is absolute — a user either pays $4.99 or they leave. There is no trial, no freemium hook, and no opportunity to demonstrate value before the transaction. This pushes user acquisition cost higher because paid acquisition campaigns must overcome both the ad click barrier and the purchase barrier.
In my experience tracking apps through Sonar, paid apps also tend to accumulate fewer ratings and reviews, which weakens their store ranking signals. Fewer installs mean fewer review prompts, which means weaker social proof, which means fewer installs — a downward spiral that ratings directly influence.
When paid upfront still works
- Professional tools with established brand recognition. Apps like Procreate built their reputation before the subscription wave and maintain pricing power through loyal communities.
- Privacy-first apps. Users who distrust ad-supported models will pay upfront for an app that collects no data.
- One-time-use utilities. A $0.99 unit converter or specialty calculator can justify its price if the value is immediate and obvious.
Hybrid Models: Combining Revenue Streams
The fastest-growing app monetization strategy in 2026 is not choosing a single model but combining them. AppsFlyer reports that within apps using all three monetization streams (subscriptions, IAP, and ads), subscription revenue increased from 4% of total revenue in January 2025 to 7% by early 2026 — a 75% increase in subscription share within hybrid apps over that 12-month window (source: AppsFlyer State of App Monetization 2026).
Common hybrid combinations
| Combination | Example pattern | Risk |
|---|---|---|
| Freemium + subscription | Free tier with ads, paid tier removes ads and adds features | Cannibalizing ad revenue if free-to-paid conversion is too high |
| IAP + ads | Consumable purchases plus rewarded video | Ad fatigue reducing IAP spend |
| Paid + IAP | Upfront price with optional premium add-ons | Low install volume limiting IAP exposure |
| Subscription + IAP | Monthly plan with additional one-time purchases | Confusing pricing for users |
The key to hybrid monetization is measurement. You need to track ARPU by cohort, not in aggregate. An overall ARPU of $2.50 could mask the fact that subscribers are worth $15 and ad-only users are worth $0.30. Sonar can help you benchmark your app's performance against competitors using the same model in your category.
How to Choose: A Decision Framework
Selecting the right app monetization strategy depends on four variables. I use this framework when advising developers who are exploring Sonar's competitive data:
- Session frequency. High-frequency apps (5+ sessions/day) can sustain ad models. Low-frequency apps need subscription or paid revenue.
- Willingness to pay. Finance, health, and productivity users pay for value. Casual game players do not. Check competitor pricing in your category through store research.
- Content refresh rate. Apps that deliver new content regularly (news, fitness programs, language lessons) justify recurring subscriptions. Static tools do not.
- Category norms. Users have strong expectations shaped by incumbents. A subscription meditation app feels normal in 2026. A subscription flashlight app does not.
When I analyze categories in Sonar, I look at the monetization model of the top 10 apps for the category's head keywords. If 8 of 10 top results for "budget planner" are subscription apps — and on iOS, "budget planner" shows Sonar difficulty 66 and popularity 51 (source: Sonar /api/v1/keywords/search, queried 2026-08-07) — that tells me the market expects and accepts subscriptions. Going against category norms means fighting user expectations and competitive dynamics simultaneously.
ASO Differences by Monetization Model
Your monetization model directly shapes your ASO strategy. Here is how metadata optimization changes depending on how you make money:
- Subscription apps should emphasize free trial availability in screenshots and descriptions. The phrase "free trial" or "try free" in the first screenshot caption directly impacts conversion rate. On iOS, use StoreKit 2 offer codes for promotional pricing.
- IAP apps benefit from showcasing premium content in screenshots without revealing everything. Tease the value behind the paywall.
- Ad-supported apps should highlight "free" prominently, but avoid mentioning ads in metadata — users filter them out. Focus on the core value proposition.
- Paid apps must justify the price in the first two screenshot frames. Lead with the specific problem solved and the specific outcome delivered.
Across all models, keyword research is the foundation. Tools like Sonar show you which keywords your competitors target, their difficulty scores, and estimated search volume — so you can find gaps where your monetization model has an advantage.
FAQ
What is the most profitable app monetization strategy in 2026?
Subscriptions generate the highest ARPU — 4.6x more than ad-only apps, according to App Verticals. Subscription revenue also grew 105% YoY in Q1 2026 (source: AppsFlyer), making it the fastest-growing model. However, profitability depends on trial-to-paid conversion rates, which sit at a median of 10.7% for hard paywalls (source: RevenueCat 2026 benchmarks).
How much commission does Apple take on app subscriptions?
Apple charges 30% commission on subscription revenue during the subscriber's first year, then drops to 15% for subscribers who maintain their subscription beyond 12 consecutive months (source: Apple Developer). Google Play charges 15% on subscription revenue from day one. Developers earning under $1 million annually qualify for Apple's Small Business Program at 15% across all transaction types.
Can I combine multiple monetization models in one app?
Yes, and hybrid models are increasingly common. AppsFlyer's 2026 data shows subscription revenue within hybrid-model apps grew from 4% to 7% of total revenue between January 2025 and early 2026 — a 75% increase in share. The most common combination is a free tier with ads plus a subscription tier that removes ads and adds features. The risk is complexity — confusing pricing can hurt your app store conversion rate.
Do paid apps still make money in 2026?
Paid apps represent only about 3% of Google Play listings, and free apps generate 98% of Play Store revenue (source: Business of Apps, 2026). Paid upfront models still work in narrow niches — professional tools, privacy-focused apps, and one-time-use utilities — but they face significant conversion rate barriers compared to free-to-download models. Without a trial or freemium tier, every potential user must commit to paying before experiencing the product.
How does monetization model affect ASO?
Subscription apps tend to invest more in metadata optimization. Sonar's ASO score data shows Rocket Money (subscription) at 94/100 versus Tip Calculator % Gold (ad-supported with subscription IAP tiers) at 78/100 (source: Sonar /api/v1/apps/aso-score, queried 2026-08-07). Monetization model also influences keyword strategy: subscription apps should target high-intent keywords like "subscription tracker" or "budget planner" where users are actively looking to spend money, while ad-supported apps may target broader, higher-volume terms.
Choosing the right monetization model is only half the equation — you also need to optimize your store presence for the keywords that drive installs. Try Sonar free to see search volume, difficulty, and competitor data for every keyword in your category.