 sonar
sonar
What an ASO dashboard actually needs: two kinds of data
An ASO dashboard is built from two data families that never come from the same place. Your own funnel numbers — impressions, product page views, downloads, proceeds — live only in App Store Connect and Play Console. Keyword ranks, search popularity and difficulty, for your app and your competitors, aren't in either console, so they have to come from a third-party keyword API or your own scraper.
This split decides your whole architecture. The first-party data is free but slow: Apple's daily Sales and Trends reports land "the following day," generally by 8 a.m. Pacific source: [Apple, Sales and Trends reports availability]. Google Play's exported statistics are "captured daily and posted within 3 to 7 days in monthly CSV files" source: [Play Console Help, Download and export monthly reports]. Rank data is the opposite. It's cheap to refresh daily, but nobody gives it to you for free at scale.
By Peter. Apple and Google documentation checked September 27, 2026. Keyword examples from Sonar's API, US storefront, pulled the same day.
This post covers the plumbing: sources, a starter stack, cadence and cost. If you still need to decide what to chart, start with ASO KPIs: what to track and why. If you're choosing between keyword API vendors, that comparison lives in ASO APIs compared (2026).
Which metric comes from which source
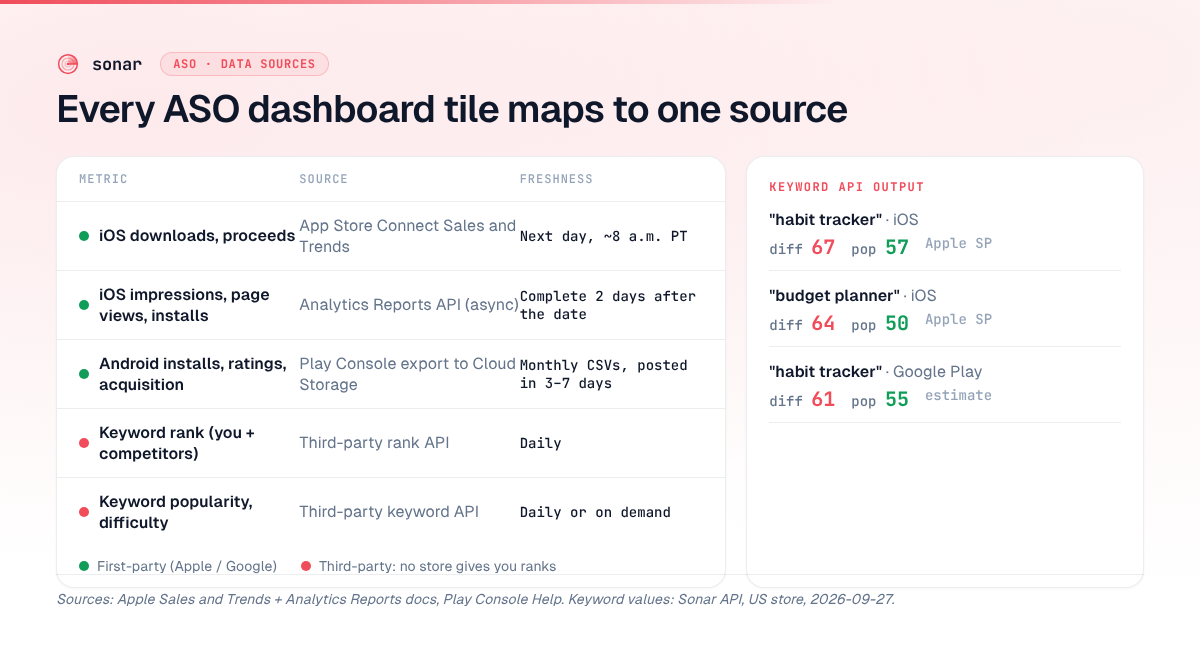
Every tile on an ASO dashboard maps to exactly one source, and the source sets how fresh the tile can be. The table below is the map I'd build from.
| Metric | Source | Access method | Freshness |
|---|---|---|---|
| iOS downloads, redownloads, proceeds | App Store Connect Sales and Trends | App Store Connect API (salesReports) | Daily, next day by ~8 a.m. PT |
| iOS impressions, product page views, installs, deletions, sessions | App Store Connect Analytics Reports | Analytics Reports API (async report requests) | Daily instances; data complete 2 days after the reporting date |
| Android installs, ratings, crashes, store performance | Play Console statistics and user acquisition reports | CSV export to a Google Cloud Storage bucket | Captured daily, posted within 3–7 days as monthly CSVs |
| Android crash rate, ANR rate | Android vitals | Google Play Developer Reporting API | On demand (daily aggregates) |
| Keyword rank (your app + competitors) | Third-party keyword/rank API | REST API | Daily |
| Keyword popularity and difficulty | Third-party keyword API | REST API | Daily or on demand |
| Rating, review count, current version | Public store listings | Store lookup or a keyword API's app snapshot | Daily |
Sources: Apple, Sales and Trends availability; Apple, Analytics reports API; Play Console Help, export reports; Google Play Developer Reporting API.
Two gaps stand out. Neither Apple nor Google gives you keyword ranks, so the ranking half of any ASO dashboard is third-party by definition. And Google's Reporting API covers "app's quality from Android vitals, including crash rate, ANR rate" — not installs or acquisition source: [Google Play Developer Reporting API]. For Android funnel numbers, the bucket export is the path.
First-party data: App Store Connect and Play Console
First-party data is the ground truth for conversion and revenue, and the only way to get it programmatically is Apple's App Store Connect API and Google's Cloud Storage export. Both are slower than people expect.
App Store Connect: two different APIs
Apple splits your numbers across two report families, and they behave differently.
- Sales and Trends is synchronous. You ask for a date and get a gzipped report back. Daily reports arrive the next day, weekly reports on Mondays, monthly reports five days after month end, and daily, weekly and monthly files are kept "for one year after they become available" source: [Apple, Sales and Trends availability]. Store them yourself if you want more than a year of history.
- Analytics Reports is asynchronous. You file a request, and Apple generates files later. An
ONGOINGrequest produces daily, weekly and monthly reports, with the first one "approximately 24-48 hours" after the request.ONE_TIME_SNAPSHOTreturns historical data source: [Apple, Analytics reports API].
Three details trip up first builds. An Admin role is required to request a report type for the first time; Sales and Reports or Finance roles can only download afterwards. Rows with fewer than 5 users or 5 unique devices are omitted, and Apple adds statistical noise. Data counts as complete two days after the reporting date source: [Apple, Analytics reports API]. So for a small app, a zero in a country breakdown can mean "under threshold," not "no users." Key setup and role scopes are covered in App Store Connect API key: scopes and automation.
Play Console: the Cloud Storage bucket
Google doesn't expose install statistics through a REST endpoint you query by date. You read CSVs from a bucket whose URI starts with pubsite_prod_rev, found via "Copy Cloud Storage URI" on the Download reports page. The export covers reviews, financial reports, statistics (installs, crashes, ratings, subscriptions) and user acquisition source: [Play Console Help]. The same page documents a service-account flow, which is what your cron should use instead of gsutil on a laptop.
The practical effect: your Android funnel tiles will lag your iOS ones by days. Label them with the data date, not the fetch date, or you'll be chasing drops that are really posting delays.
Third-party data: keyword ranks, popularity and difficulty
Keyword ranks and keyword demand have to come from outside the consoles, because neither Apple nor Google exposes where your app ranks for a search term. A keyword API gives you three fields a dashboard needs: rank per keyword per day, a popularity score, and a difficulty score.
Here's what that looks like from Sonar's API (US store, queried September 27, 2026):
| Keyword | Store | Difficulty | Popularity | Popularity source |
|---|---|---|---|---|
| habit tracker | iOS | 67 | 57 | Apple Search Popularity |
| budget planner | iOS | 64 | 50 | Apple Search Popularity |
| habit tracker | Google Play | 61 | 55 | Sonar estimate (proxy) |
Source: Sonar /api/v1/keywords/search (iOS) and /api/v1/keywords/metrics (Android), queried 2026-09-27.
The popularity_source field matters for a dashboard. On iOS, "habit tracker" returns "apple", meaning the value is Apple's own Search Popularity. On Google Play it returns "proxy", an estimate, because Google publishes no equivalent number. Show that source on the chart, or someone will compare the two stores as if they were the same scale. The iOS result also carries est_downloads_at_1 (590 for "habit tracker", 390 for "budget planner") and results_count (192 for "habit tracker") — useful as columns, not as tiles.
For the rank half, the endpoint shape is what you design your table around. GET /api/v1/apps/:id/rankings returns data[] of {keyword_id, keyword, history: [{rank, measured_at}]}, with days from 1 to 365 (default 30), limit of 1–200 keywords per page, and a pagination.next_cursor / has_more pair source: Sonar API docs, [/aso-api]. That maps one-to-one onto a long table: one row per keyword per day. Deeper rank-tracking patterns are in App Store rank tracking API.
A starter stack in three sizes
The right stack depends on how many apps and how much history you want. Pick the smallest one that fits. You can move up later without changing sources.
| Stack | Good for | Storage | Scheduler | Weak spot |
|---|---|---|---|---|
| Google Sheets + Apps Script | 1–3 apps, a few hundred keywords | Sheet tabs | Time-driven triggers | Quotas, sheet size |
| Looker Studio on Sheets or BigQuery | Sharing charts with a cofounder or client | Sheets / BigQuery | Upstream job | Only a viz layer |
| Postgres + a cron job | Several apps, multi-year history | Postgres tables | cron / GitHub Actions / any scheduler | You maintain it |
Sheets + Apps Script
This is the fastest ASO dashboard you can ship, and the quotas are generous for a solo developer. Consumer Google accounts get 20,000 URL Fetch calls a day, 90 minutes of trigger runtime a day, and 6 minutes per execution; Workspace accounts get 100,000 calls and 6 hours source: [Apps Script quotas]. A daily rank pull is a handful of calls, so you won't come close.
The script below pulls the last 7 days of rank history for every tracked app into a ranks tab. It uses only real Sonar fields: GET /apps for the app list (filtered to your own apps via is_own; drop the filter to chart competitors too) and GET /apps/:id/rankings, both with cursor pagination.
// Apps Script: Extensions → Apps Script. Store the key in
// Project Settings → Script properties as SONAR_API_KEY.
const BASE = "https://trysonar.app/api/v1";

function sonarGet(path) {
  const key = PropertiesService.getScriptProperties().getProperty("SONAR_API_KEY");
  const res = UrlFetchApp.fetch(BASE + path, {
    headers: { Authorization: "Bearer " + key },
    muteHttpExceptions: true,
  });
  if (res.getResponseCode() !== 200) {
    throw new Error(path + " → " + res.getResponseCode() + " " + res.getContentText());
  }
  return JSON.parse(res.getContentText());
}

function pullRanks() {
  const ss = SpreadsheetApp.getActive();
  const sheet = ss.getSheetByName("ranks") || ss.insertSheet("ranks");
  const rows = [];

  // /apps is cursor-paginated and includes competitors (is_own: false).
  const apps = [];
  let appCursor = null;
  do {
    const page = sonarGet("/apps?limit=200" + (appCursor ? "&cursor=" + appCursor : ""));
    apps.push(...page.data.filter((a) => a.is_own));
    appCursor = page.pagination.has_more ? page.pagination.next_cursor : null;
  } while (appCursor);

  apps.forEach((app) => {
    let cursor = null;
    do {
      const qs = "?days=7&limit=200" + (cursor ? "&cursor=" + cursor : "");
      const page = sonarGet("/apps/" + app.id + "/rankings" + qs);
      page.data.forEach((kw) => {
        kw.history.forEach((h) => {
          rows.push([h.measured_at, app.store, app.name, kw.keyword, h.rank]);
        });
      });
      cursor = page.pagination.has_more ? page.pagination.next_cursor : null;
    } while (cursor);
  });

  sheet.clearContents();
  sheet.getRange(1, 1, 1, 5).setValues([["date", "store", "app", "keyword", "rank"]]);
  if (rows.length) sheet.getRange(2, 1, rows.length, 5).setValues(rows);
}
Add a time-driven trigger (Triggers → Add trigger → pullRanks, day timer) and you have a daily-refreshing rank table. Pivot it, or point Looker Studio at it. The same /apps response includes latest_snapshot with rating, review_count, version, installs and measured_at, so a second tab of listing health is five more lines.
Postgres + a cron
Move to Postgres when you want more than a year of first-party history (Apple drops daily Sales and Trends files after one year, per the availability page above) or when joins get painful in Sheets. Three tables cover most of it: ranks(date, app, keyword, rank), keyword_metrics(date, keyword, store, popularity, popularity_source, difficulty), and sales_daily(date, app, country, downloads, proceeds). Upsert on the natural key so reruns are harmless. Point Looker Studio, Metabase or Grafana at it.
Skip the dashboard: MCP
If the "dashboard" is really you asking questions every Monday, an MCP server can replace the charts. Sonar publishes @sonarapp/mcp, which exposes the same API as tools to Claude and other MCP clients. Setup is in Automate ASO with Claude: MCP setup guide, and shell-script versions of the same pulls are in ASO API: CLI workflows.
Refresh cadence: don't poll faster than the data moves
Match each job to its source's publishing rhythm. Anything faster burns quota and shows you the same numbers.
- Keyword ranks: once a day. Sonar records each tracked keyword's rank once per day, so a 7-day window per pull gives you overlap to heal missed runs.
- Keyword popularity and difficulty: weekly is enough for a dashboard. In our experience demand scores move far less day to day than ranks do.
- Sales and Trends: daily, after 8 a.m. PT, for the previous day source: [Apple].
- Analytics Reports: file the
ONGOINGrequest once, then check daily for new instances. Treat the last two days as provisional source: [Apple]. - Play Console bucket: daily or weekly reads of the current month's CSVs, remembering the 3–7 day posting window source: [Play Console Help].
What it costs to build your own ASO dashboard
For a solo developer, the cash cost of a DIY ASO dashboard is mostly the keyword data, because the first-party APIs and Apps Script carry no extra charge. The real cost is your time.
Estimated monthly cost, based on the published quotas and prices cited here (your hosting choice will vary):
| Line item | Cost | Basis |
|---|---|---|
| App Store Connect API, Play Console export | $0 beyond your developer accounts | Neither Apple's nor Google's report docs cited above list a fee |
| Google Sheets + Apps Script | $0 | Free consumer quotas above |
| Keyword + rank data (Sonar) | $19/month (Indie) or credit packs from $10 | Sonar pricing |
| Your time | Estimate: a weekend to build, an hour or two a month to maintain | My experience; breakage comes from report format and API changes |
On Sonar specifically: the org-scoped endpoints the script uses (tracked apps, rankings, overview) need the Indie or Agency plan. Indie is $19/month and includes the REST API at 1,000 requests a day, the CLI and CSV/JSON export. Stateless lookups can run on API Credits instead — packs from $10, 50 free credits on signup, 1 credit per stateless call and 10 credits per keyword research call source: [Sonar pricing]. The daily pull above is roughly one call for the app list plus one per app per 200 keywords. That's an estimate from the pagination limits, and well under 1,000 a day for a small portfolio.
When building your own is not worth it
Build your own ASO dashboard when you need something a product can't give you: your sales data joined to ranks, a client-specific layout, or data inside a warehouse you already run. Don't build one to recreate a rank chart.
If your dashboard would be "ranks over time plus a visibility score," that's the core of every hosted ASO tool, including Sonar's own dashboard, and GET /api/v1/apps/:id/overview already returns it computed: tracked, ranked and top-10 keyword counts, best rank, a visibility score and share of voice with 7-day deltas, and a daily spark. Rebuilding that math in Sheets is a weekend spent on a solved problem. The DIY part worth owning is the join: first-party conversion next to third-party ranks. No single vendor sees both halves.
FAQ
What is an ASO dashboard?
An ASO dashboard is a single view of your App Store and Google Play search performance: keyword ranks, keyword demand, and the conversion funnel from impressions to downloads. The funnel data comes from App Store Connect and Play Console, and the keyword data comes from a third-party API.
Can I get keyword rankings from App Store Connect or Play Console?
No. Neither console reports where your app ranks for a given search term. Apple's analytics cover impressions, page views and downloads by source, and Google's Reporting API covers Android vitals source: [Google Play Developer Reporting API]. Ranks need a keyword/rank API or your own scraper.
How often should an ASO dashboard refresh?
Daily for ranks and Apple Sales and Trends, which publishes the previous day by about 8 a.m. PT. Apple's Analytics Reports are complete two days after the reporting date, and Play Console CSVs post within 3–7 days, so refreshing those more than daily gains nothing.
Is Google Sheets enough for an ASO dashboard?
For one to three apps, yes. Apps Script's consumer quota of 20,000 URL fetches a day is far above what a daily rank pull needs source: [Apps Script quotas]. Move to Postgres when you want multi-year history or need to join sales and rank data at scale.
Which API should I use for keyword data?
Pick one that returns rank history, popularity and difficulty for both stores and tells you where the popularity number comes from. Sonar returns Apple's own Search Popularity on iOS and flags Android values as estimates. A side-by-side of the options is in ASO APIs compared (2026).
Want the rank and keyword half of your dashboard without building the scraper? Sonar's Indie plan includes the REST API, CLI and CSV/JSON export, and API Credits start at $10 — see pricing and start free trial.