sonar
sonar
How app store ratings actually affect rankings (and where they don't)
Ratings are a ranking input on both stores. Apple and Google both say so. What neither says is how much they weigh, and the ASO advice that fills the gap is mostly folklore: "get to 4.5 stars and rankings follow", "the app with the most reviews wins".
So we measured it. In Sonar's data on 4,629 US App Store keyword top 10s (refreshed September 28 to October 1, 2026), the #1 app had more ratings than the #2 app only 51% of the time — a coin flip. And the 4.5-star threshold that many ASO guides repeat, including an earlier version of this one, doesn't show up: inside the top 10, apps rated 4.3–4.5 reached the top three about as often as apps rated 4.5–4.7.
This article covers what the stores say, what Sonar's data shows for the App Store and Google Play, what the data can't tell you, and what to do about your ratings anyway.
What Apple and Google say about ratings
Neither store publishes its ranking algorithm, but both name ratings as an input.
Apple: "Search results are based on a number of factors, including text relevance (matches for your app's title, subtitle, keywords, and primary category), as well as user behavior (downloads, ratings and reviews, and more)." It adds that ratings and reviews "can influence how your app ranks in App Store search" [source: developer.apple.com/app-store/search/].
Google: "Apps are ranked based on a combination of ratings, reviews, downloads, and other factors," and Google Play search "factors in the overall experience of your app based on user behavior and feedback" [source: support.google.com/googleplay/android-developer/answer/4448378].
The takeaway: both stores confirm ratings are inputs, listed next to downloads and text relevance. Neither says ratings are the dominant one, and neither mentions a threshold.
What Sonar's data shows: ratings across thousands of keyword top 10s
Sonar refreshes the top results for every keyword its users track, every day. For this article we pulled the latest results pages refreshed between September 28 and October 1, 2026, and looked at them three ways.
How we measured
- Full top 10s (rating counts only). For 9,565 App Store keywords (4,629 of them US) and 8,732 Google Play keywords (2,832 US), Sonar's difficulty calculation records the strength of the #1, #2 and #3 apps and the median app in the top 10. Strength is the rating count on the App Store and the install count on Google Play.
- Every position (rating counts and stars). For a random 8,000 keywords, we matched each top-10 app to Sonar's app records to get its rating count and average star rating. Sonar only holds those for apps someone tracks, which covered 24% of App Store and 20% of Google Play top-10 slots (34% at #1, falling to 17% at #10). This cut is the biased one: it over-represents the apps Sonar users care about.
- The 4.5-star test. For the same covered apps, how often each star-rating band reaches the top three of its top 10, and how often top-10 apps are rated 4.5+ compared with all tracked apps that have a similar number of ratings.
Two caveats apply throughout. App Store positions come from Apple's iTunes Search API, which orders results by text relevance; it matched true App Store order closely on head terms in our checks, but runs optimistic on long-tail terms, and a relevance order could understate how much a popularity signal like ratings matters in the real App Store. Google Play positions come from Play's own search results. And all of this is about apps already in a top 10: it says nothing about whether low-rated apps are kept out of the top 10 in the first place.
The #1 app out-rates #2 only half the time
| App Store, US | App Store, 70 storefronts | Google Play, US | Google Play, 72 storefronts | |
|---|---|---|---|---|
| Top 10s analyzed | 4,629 | 9,565 | 2,832 | 8,732 |
| #1 has more than #2 | 51% | 51% | 55% | 56% |
| #1 has more than the median app in the top 10 | 61% | 63% | 66% | 66.5% |
| #1 has less than a tenth of the median app | 18% | 17% | 12% | 12% |
| #1 has fewer than 100 ratings | 17.5% | 25.6% | – | – |
Source: Sonar, keyword top 10s refreshed Sep 28–Oct 1, 2026. "More" means more ratings on the App Store and more installs on Google Play.
If rating count decided the order, the #1 app would out-rate #2 nearly every time. It does so about half the time on the App Store and only slightly more often on Google Play. In the US App Store sample the typical #1 app had about 9,400 ratings, the typical #2 about 10,000 and the typical #3 about 8,100: the top three are close, and their order isn't set by who has the most.
Rating count isn't meaningless. The #1 app beat the median of its top 10 more often than not (61% in the US App Store sample), so bigger apps do tend to sit near the top. But about one US App Store top 10 in six is led by an app with fewer than 100 ratings.
Within a top 10, ratings line up with position only weakly
The second cut asks a sharper question: within one results page, do the apps with more ratings, or more stars, sit higher? We measured that as a rank correlation for every top 10 with at least four covered apps (1,096 on the App Store, 799 on Google Play). On that scale, 1 would mean the order exactly follows the rating figure and 0 would mean no relationship at all.
The typical App Store top 10 scored 0.20 for rating count and 0.09 for average star rating. Google Play scored 0.25 and 0.17. In about 4 in 10 App Store top 10s, more ratings did not go with a higher position at all. Rating count lines up with position a little; star rating barely does.
There's no 4.5-star step inside the top 10
If 4.5 stars were a threshold, apps just above it should reach the top three noticeably more often than apps just below it. They don't:
| Average rating | App Store: share in the top 3 | App Store top-10 slots | Google Play: share in the top 3 | Google Play top-10 slots |
|---|---|---|---|---|
| Under 4.0 | 49% | 220 | 40% | 689 |
| 4.0–4.3 | 41% | 307 | 37% | 865 |
| 4.3–4.5 | 35% | 632 | 42% | 1,124 |
| 4.5–4.7 | 39% | 2,837 | 40% | 2,354 |
| 4.7–5.0 | 41% | 5,459 | 46% | 2,032 |
Source: Sonar, 8,000 keyword top 10s refreshed Sep 28–Oct 1, 2026, apps with stored ratings only. Every band sits above the 30% you'd expect by chance because Sonar tracks more of the apps at the top of the results, so compare the bands with each other.
On the App Store, apps rated 4.3–4.5 reached the top three 35% of the time and apps rated 4.5–4.7 39% — a 4-point gap, smaller than the one between 4.0–4.3 and 4.3–4.5 running the other way. On Google Play the band just below 4.5 did slightly better than the band just above it. Splitting apps by how many ratings they have doesn't produce a consistent step either. (The App Store's sub-4.0 group is small and made up mostly of apps with few ratings, so don't read its 49% as "low ratings help".)
What is true is that almost everything in an App Store top 10 is rated highly. At every position from #1 to #10, between 86% and 90% of the covered apps were rated 4.5 or higher, and the median rating was 4.71 to 4.74:
| Position | Rated 4.5+ | Median rating | Median rating count | Slots with ratings data |
|---|---|---|---|---|
| #1 | 88% | 4.73 | 23,168 | 34% |
| #2 | 90% | 4.74 | 25,249 | 31% |
| #3 | 87% | 4.72 | 23,168 | 27% |
| #5 | 88% | 4.72 | 21,306 | 23% |
| #7 | 89% | 4.73 | 24,563 | 20% |
| #10 | 89% | 4.72 | 20,434 | 17% |
Source: Sonar, 4,281 App Store top 10s across storefronts, refreshed Sep 28–Oct 1, 2026, apps with stored ratings only.
There's no slope from #1 to #10. And compared with all apps Sonar tracks that have a similar number of ratings, top-10 apps are only a few points more likely to be rated 4.5+: 85% vs 77% for apps with 1,000 to 9,999 ratings, 91% vs 89% for 10,000 to 99,999. On Google Play the bar is lower: 57% to 65% of covered top-10 apps were rated 4.5+ at each position, and about 1 in 10 were rated under 4.0.
So 4.5 stars is the norm in an App Store top 10, not a cutoff that moves you up within it.
What the data can't tell you
- Whether ratings keep apps out of the top 10. Everything above is conditional on already being there. A 3.8-star app may struggle to get in at all; this data can't see that.
- Apple's or Google's weights. These are correlations in observed results, not the stores' formulas.
- The real App Store order on long-tail terms. iOS positions come from a relevance-ordered API, so a popularity effect could be understated.
- Per-storefront ratings at the time of the search. Rating counts and stars are each app's latest stored values.
The honest reading: ratings matter, but inside a top 10 they don't sort the order much, and there's no magic number of stars.
A top 10 up close: meditation apps
Here is what that looks like for one category. These were the top 10 meditation apps tracked by Sonar on iOS in May 2026:
| App | Rating | Reviews | Rank |
|---|---|---|---|
| Insight Timer | 4.90 | 439,530 | 1 |
| Calm | 4.77 | 1,953,560 | 2 |
| Headspace | 4.84 | 974,036 | 3 |
| Balance | 4.88 | 119,361 | 4 |
| Medito | 4.90 | 4,015 | 5 |
| Waking Up | 4.92 | 42,356 | 6 |
| Open | 4.88 | 16,283 | 7 |
| Happier Meditation | 4.82 | 142,627 | 8 |
| Breethe | 4.74 | 70,679 | 9 |
| Aura | 4.67 | 34,923 | 10 |
Source: Sonar meditation app index, iOS, May 2026.
It matches the larger data. Every app is rated above 4.5, like most App Store top 10s, so stars can't be what separates them. Review counts vary nearly 500-fold, from Medito's 4,015 to Calm's 1.95 million, and they don't set the order either: Medito sits 5th with about 4,000 reviews, Calm 2nd with nearly 2 million, and the #1 app has fewer reviews than #2 and #3.
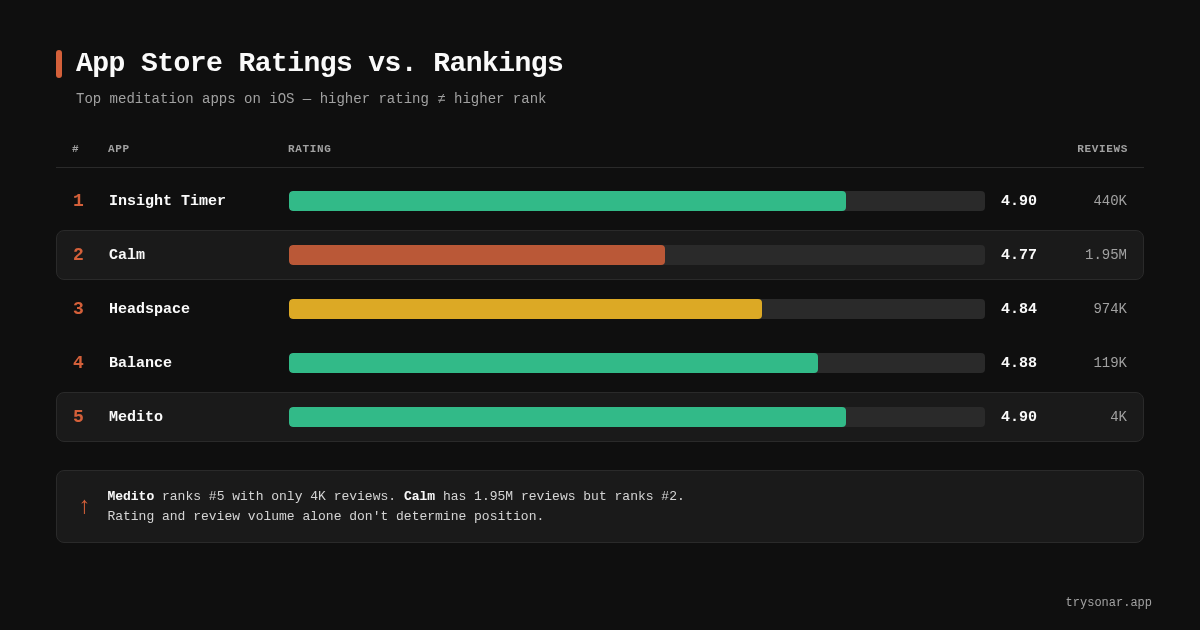
Star ratings vs. review volume: which weighs more?
There is no public formula, but Sonar's data points one way: rating count lines up with position a little more than star rating does, and neither decides the order inside a top 10. That fits what the stores say — ratings are one input among several — and it fits the meditation example.
Where stars clearly matter is conversion. Your average rating appears next to your app in search results and on your product page, and people use it to decide whether to tap and install. A widely cited Apptentive survey of US smartphone owners linked a move from 3 to 4 stars to an 89% rise in conversion; it measured what people said they would download rather than what they did, but the direction is not in doubt. More installs from the same impressions is the route by which a better rating can feed rankings over time.
Volume works the same way. A 4.9-star app with 40 reviews looks different to users than a 4.8-star app with 100,000 reviews, and the larger count can win the tap even when the stars are lower.
For a deeper look at what to measure and how to track improvement, see ASO KPIs: What to Track and Why.
Why ratings alone cannot carry your ASO
Sonar's ASO score breakdown from the same May 2026 snapshot shows the point. Calm, with 1.95 million reviews and a 4.77 rating that earned 15/15 on the Rating check, scored only 78/100 overall because its single-word title underperformed on Title Length (4/15) and Title Keywords (1/10). Ratings didn't compensate for thin metadata.
Insight Timer, by contrast, uses its title, "Insight Timer: Meditate, Sleep," and earned 15/15 on Title Length and 10/10 on Title Keywords. With its 4.90 rating and 439K reviews, it scored 98/100.
The 20-point difference came entirely from metadata, not ratings. Both apps scored perfectly on the Rating check. Insight Timer's title carries words people search for, while "Calm" is a single brand word.
A high rating is necessary but not sufficient. You also need keyword-rich titles (see iOS App Title Length: What Fits, What Gets Cut, and How to Use Every Character), well-structured descriptions, quality screenshots, and regular updates. An ASO audit helps identify which signals are dragging down an otherwise strong listing.
How ratings differ between iOS and Google Play
The data shows two different markets. App Store top 10s are almost uniformly highly rated (86–90% at 4.5+ and at most about 3% under 4.0 at each position, among the apps Sonar tracks). Google Play top 10s are more mixed: 57–65% at 4.5+ and about 1 in 10 under 4.0. On Google Play the #1 app out-installs #2 slightly more often (55% in the US) than the App Store's #1 out-rates its #2 (51%).
The platforms also handle ratings differently:
iOS App Store:
- Users can leave a star rating without writing a review
- Developers can prompt for a rating in-app with
SKStoreReviewController, which Apple limits to three prompts per 365-day period per device [source: developer.apple.com/documentation/storekit/skstorereviewcontroller] - Developers can choose to reset the summary rating when they release a new version
Google Play:
- Since 2019 the rating shown on a listing gives more weight to recent ratings than to old ones; Google hasn't published the exact weighting [source: techcrunch.com/2019/05/08/google-play-is-changing-how-app-ratings-work/]
- There is no manual reset, so recovering from a bad stretch means shipping a better version and collecting newer ratings
- Google's In-App Review API allows prompts, but Google controls when the dialog appears [source: developer.android.com/guide/playcore/in-app-review]
- Developer replies to reviews are visible on the listing and can influence sentiment
For more on how ASO strategy changes across platforms, see our Google Play ASO guide.
Practical ways to improve your app store ratings
Knowing that ratings are an input is step one. Moving the number is step two. Here are approaches grounded in what the stores allow.
Time your rating prompts correctly
The single highest-leverage action is prompting users at the right moment. Ask after a positive event — a completed workout, a saved file, a streak milestone — not after a crash or during onboarding.
On iOS, SKStoreReviewController.requestReview() is the only sanctioned prompt method. Apple limits it to three appearances per app per year per device, and Apple controls whether the dialog actually shows [source: developer.apple.com/documentation/storekit/skstorereviewcontroller]. On Android, Google's In-App Review API similarly controls display timing [source: developer.android.com/guide/playcore/in-app-review].
For a complete playbook on review collection, see How to Get More App Reviews (Without Being Annoying).
Respond to negative reviews
On Google Play, developer responses to reviews are public. A thoughtful response to a 1-star review can prompt the user to revise their rating — Google notes that users can update their review after receiving a response [source: support.google.com/googleplay/android-developer/answer/138230].
On iOS, developer responses have been available since iOS 10.3 [source: developer.apple.com/app-store/responding-to-reviews/]. Apple doesn't say responses affect ranking, but they do affect conversion. A product page where the developer visibly engages with feedback converts better than one with unanswered complaints.
Fix the issues that drive low ratings
This sounds obvious, but it is the most underused strategy. Pull your 1-star and 2-star reviews. Categorize the complaints. If 40% mention crashes on a specific device, fixing that crash will improve your rating faster than any prompt strategy.
Google Play Console surfaces review topics and sentiment trends [source: support.google.com/googleplay/android-developer/answer/138230]. App Store Connect offers a simpler review list. Use these to prioritize the bug fixes that will have the biggest effect on your rating.
Use version resets strategically (iOS only)
iOS lets you reset your star rating when you ship a new version. This can help if your lifetime rating is dragged down by bugs you have already fixed. But resetting means you start from zero visible ratings, which can hurt conversion rates until enough new ratings accumulate.
Only reset if your current-version rating is clearly higher than your lifetime average and you have enough install volume to rebuild quickly. Sonar's data gives one more reason for caution: since a few tenths of a star don't move position inside a top 10, a reset is about conversion, not about crossing a ranking threshold.
The feedback loop: ratings, conversions, and rankings
Ratings sit inside a feedback loop:
- Higher rating leads to a better conversion rate on your search result and product page
- Higher conversion rate means more installs per impression
- More installs feed the download signals both stores name as ranking inputs
- Higher ranking generates more impressions
- More impressions at a steady conversion rate means more installs and more ratings
Sonar's data suggests the loop runs mostly through conversion and installs, not through the rating figure itself: inside a top 10, the star rating barely lines up with position. So treat a rating improvement as a conversion project. Measure it in tap-through and install rate first, and expect any ranking effect to follow slowly, through installs.
The loop works in both directions. A rating drop from 4.5 to 4.0 can hurt conversion, which lowers installs, which lowers ranking, which further reduces impressions.
What ratings cannot do
For all their importance, ratings have clear limits as a ranking lever:
- They cannot fix bad keyword targeting. If your metadata does not contain the terms users search for, a 5.0 rating will not make you visible for those queries. Keywords are indexed from titles, subtitles (iOS), short and long descriptions (Google Play), and keyword fields — not from reviews. Learn more in App Store keyword research: a 6-step workflow.
- They cannot substitute for downloads. Both stores name downloads next to ratings; a beautifully rated app nobody installs has little to rank on.
- They cannot overcome category mismatch. If your app is in the wrong primary category, your ratings help you compete against the wrong set of apps.
Ratings are one signal in a multi-signal system. They amplify other signals when they are strong and suppress them when they are weak.
FAQ
Is there a 4.5-star threshold for App Store rankings?
Not that Sonar's data can find. Across thousands of keyword top 10s refreshed in late September 2026, App Store apps rated 4.3–4.5 reached the top three 35% of the time and apps rated 4.5–4.7 39% of the time, a small gap with no step at 4.5; on Google Play the band below 4.5 did slightly better. About 87% of App Store top-10 apps are rated 4.5+, so 4.5 is the norm in a top 10, not a cutoff. The data only covers apps already in a top 10, so it can't rule out that low ratings keep apps out.
How many stars do I need to rank well in the App Store?
There is no published minimum, and Sonar's data shows no step at any rating inside the top 10. In practice most top-10 apps on the App Store are rated 4.5 or higher, so aim there for conversion: your rating is shown next to your app in search results, and people use it to decide whether to install.
Do review counts matter more than star ratings?
A little more, in Sonar's data, but neither decides the order. Within a top 10, rating count lined up with position at 0.20 on a 0-to-1 scale on the App Store and star rating at 0.09 (Google Play: 0.25 and 0.17). The #1 app had more ratings than the #2 app only 51% of the time in 4,629 US App Store top 10s.
Should I reset my App Store ratings when I release a new version?
Only if your current-version rating is substantially higher than your lifetime average and your install volume is large enough to rebuild ratings quickly. Resetting means new visitors see no rating until fresh ratings come in, which can hurt your conversion rate in the short term [source: developer.apple.com/app-store/ratings-and-reviews/]. For most apps, it is better to let positive new ratings gradually pull up the average.
Do Google Play and the iOS App Store treat ratings differently?
Yes. Since 2019 Google Play's displayed rating weights recent ratings more heavily than old ones, and there is no manual reset [source: techcrunch.com/2019/05/08/google-play-is-changing-how-app-ratings-work/]. Apple lets you choose to reset your summary rating with a new version. In Sonar's data the stores' top 10s also look different: almost uniformly 4.5+ on the App Store, more mixed on Google Play.
Can I pay for or incentivize app reviews?
No. Both Apple and Google prohibit incentivized reviews. Apple's App Store Review Guidelines (Section 5.6.3) ban manipulated ratings or reviews [source: developer.apple.com/app-store/review/guidelines/#legal]. Google's Developer Program Policy similarly forbids incentivized ratings [source: support.google.com/googleplay/android-developer/answer/9899234]. Violations can result in app removal. The only sanctioned approach is using each platform's native review prompt APIs and delivering a product experience worth rating highly.
---
Want to see how your app's ratings compare with the apps you compete against — and where your metadata might be leaving points on the table? Start free trial — Sonar breaks down your ASO score across ratings, title keywords, descriptions and more.