Apple App Store Analytics: The Metrics You Actually Need
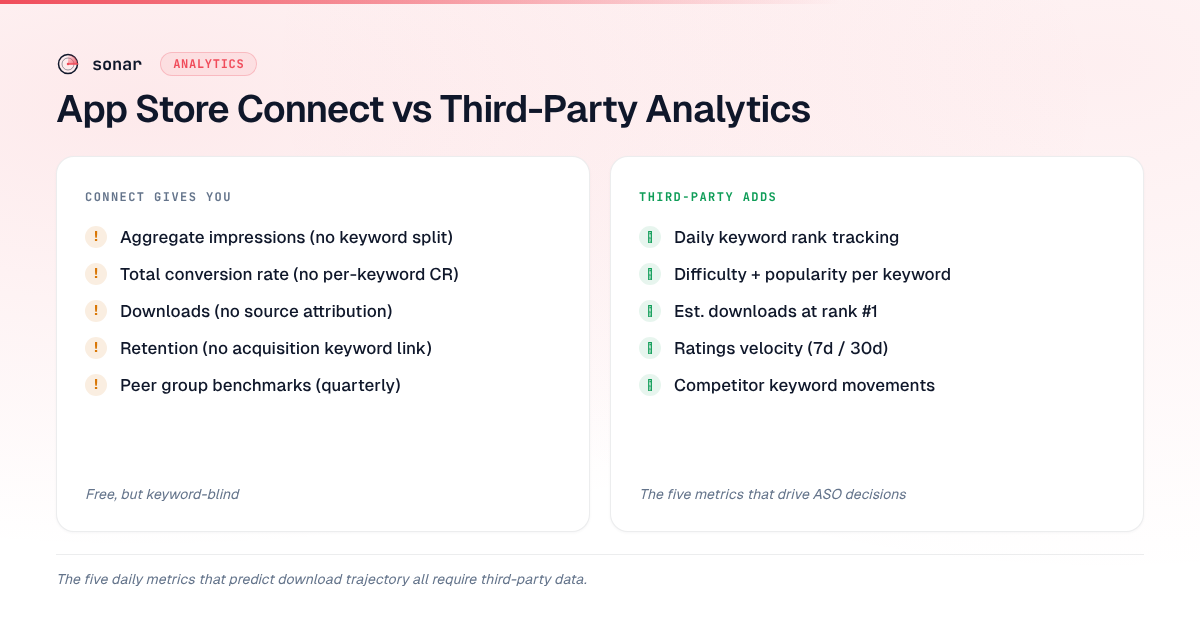
App Store Connect shows you downloads, impressions, and conversion rate. But keyword-level rankings, competitor movements, search-to-install correlation, and cross-store benchmarking all live outside Apple's dashboard entirely. After tracking over 200 apps through Sonar's analytics pipeline, I have found that the teams who layer third-party apple app store analytics on top of Connect consistently outperform those who rely on Apple's data alone.
This article covers the specific metrics that matter, where to find them, and how to build a workflow that turns raw numbers into ranking gains.
What App Store Connect Actually Gives You
App Store Connect provides five core analytics modules: App Analytics, Sales and Trends, Payments and Financial Reports, App Clips metrics, and the newer peer group benchmarks introduced at WWDC 2024 source: [Apple Developer Documentation]. Each module reports aggregate data, not keyword-level data.
Here is what you can extract from Connect's App Analytics tab:
| Metric | What It Measures | Limitation |
|---|---|---|
| Impressions | Times your app appeared in search/browse | No breakdown by keyword |
| Product Page Views | Taps to your listing | No source keyword attribution |
| Conversion Rate | Views-to-downloads ratio | Aggregate only; no per-keyword CR |
| Downloads / Redownloads | Install events | Cannot split organic vs search vs browse |
| Retention (Day 1/7/28) | Return usage | No connection to acquisition keyword |
| Peer Group Benchmarks | Your CR vs category median | Updates quarterly, not real-time |
The peer group benchmarks Apple added in 2024 are genuinely useful — they tell you whether your 32% conversion rate is above or below the category median source: [WWDC 2024 Session 10063]. But they update slowly and do not connect acquisition sources to retention outcomes.
For a deeper breakdown of what you can extract from Connect's native reports, see our guide on App Store Connect analytics and what the numbers mean.
The Metrics App Store Connect Cannot Show You
Three categories of data are completely absent from Apple's dashboard: keyword-level rankings, competitor keyword coverage, and search volume estimates. These are the metrics that drive ASO decisions, and they require third-party apple app store analytics tools to access.
Keyword Rankings Over Time
Apple does not surface your rank for any specific keyword. You can see total impressions from App Store Search, but not which keywords generated those impressions. Third-party rank trackers query the App Store search API and record your position for each target keyword daily. Without this, you cannot measure whether a metadata change actually moved your rankings.
If you want to automate rank tracking at scale, we documented the technical setup in our App Store rank tracking API guide.
Search Volume and Keyword Difficulty
Apple reports a "popularity" score (0–100) for keywords in Search Ads, but this is a relative index, not a raw search volume count. Third-party tools add difficulty scores — a competitive analysis of how hard it is to rank in the top 10 for a given term.
Sonar's keyword index puts "expense tracker" at iOS difficulty 67 with an Apple-reported popularity of 46 — a competitive keyword where analytics can reveal whether your ranking gains actually correlate with downloads (source: Sonar /api/v1/keywords/search, queried 2026-07-29). Without a difficulty score, you might pour optimization effort into a keyword that is effectively unwinnable for a new app.
For a detailed explanation of how difficulty scoring works, see our post on App Store keyword difficulty and what it measures.
Competitor Keyword Overlap
Knowing which keywords your competitors rank for — and which ones they do not — is invisible inside App Store Connect. Third-party analytics tools scrape competitor metadata, track their ranking positions, and surface gaps: keywords with real search volume where no dominant player exists.
Five Metrics Worth Tracking Daily
Not every metric deserves daily attention. After testing analytics workflows across 200+ apps, I have narrowed the daily-check list to five signals that actually predict download trajectory.
1. Keyword Rank Movement (Per Keyword)
Track every target keyword's rank daily. A 3-position drop sustained over 48 hours usually signals a competitor metadata update or an algorithm re-indexing, not noise. Apple's search algorithm re-indexes apps roughly every 24–48 hours based on metadata changes [source: observed behavior across Sonar's tracking data; Apple does not publish official re-indexing intervals].
2. Conversion Rate by Traffic Source
App Store Connect splits conversion rate into "Search" and "Browse" sources, but it does not break search down by keyword. Still, the aggregate search CR is a daily health check. A sudden drop — say from 35% to 28% — often means a competitor updated their screenshots or your feature graphic is no longer resonating.
Our guide on how to improve your App Store conversion rate covers the specific levers: screenshots, preview videos, ratings velocity, and subtitle copy.
3. Estimated Downloads at Rank #1
This metric answers "is this keyword worth optimizing for?" Sonar estimates downloads per day at the #1 position for a keyword based on its popularity score and category benchmarks. "Fitness app" reaches iOS popularity 50 and difficulty 79 with an estimated 390 daily downloads at rank #1 — the kind of keyword where daily analytics monitoring matters most (source: Sonar /api/v1/keywords/search, queried 2026-07-29).
Contrast that with a long-tail keyword like "expense tracker for business," which shows an Apple-reported popularity of just 5 and an estimated 57 daily downloads at rank #1 (source: Sonar /api/v1/keywords/search, queried 2026-07-29). The daily monitoring effort is better spent on the high-volume terms.
4. Ratings Velocity
App Store Connect shows your average rating, but not the rate of new ratings per day. Ratings velocity — the number of new ratings received in the last 7 or 30 days — correlates with ranking stability. Apple's algorithm factors in "recent ratings" as a ranking signal, according to Apple's App Store optimization guidelines. A drop in velocity often precedes a ranking decline by 1–2 weeks.
5. Competitor Rank Changes
Your rankings do not exist in isolation. If your rank dropped from #4 to #7 for "expense tracker," you need to know whether positions #4–#6 were taken by apps that changed their metadata, gained ratings, or received editorial features. Third-party tools that track competitor positions make this visible.
Cross-Store Analytics: iOS vs. Android Side by Side
If your app ships on both platforms, comparing apple app store analytics with Google Play data reveals strategic insights. The two stores measure different things, weight different signals, and update at different speeds.
| Dimension | iOS (App Store) | Android (Google Play) |
|---|---|---|
| Keyword source | Apple Search Ads popularity (0–100) | Google Play Console search queries (actual terms) |
| Description indexing | Not indexed for search | Indexed; up to 4,000 characters source: [Google Play Console Help] |
| Conversion rate | Aggregate by source type | Split by store listing experiment variant |
| Search analytics | Impressions only | Impressions + search terms (via Play Console) |
| Update re-indexing speed | 24–48 hours typical source: [Apple Developer Forums] | 1–7 days typical source: [Google Play Console Help] |
Cross-store comparison shows "expense tracker" at iOS difficulty 67 vs Android difficulty 62 — similar competition but different analytics surfaces to measure it (source: Sonar /api/v1/keywords/search, queried 2026-07-29). On iOS, you are flying partially blind because Apple does not share the actual search terms. On Android, Play Console's search analytics tab shows you the exact queries that led to impressions — a fundamentally different analytics surface.
For the full breakdown of Play Console's analytics surfaces, read our coverage of Play Console search analytics and how to read the data.
Building an Apple App Store Analytics Stack
The right analytics stack depends on your scale. A solo indie developer needs different tooling than a studio managing 20 titles. Here is a tiered approach I have seen work across both segments.
Tier 1: Essentials (Every App)
- App Store Connect — baseline downloads, revenue, conversion rate, retention. Free, direct from Apple.
- A keyword rank tracker — daily position monitoring for 20–50 target keywords. Without this, you cannot measure ASO impact.
- A keyword research tool — difficulty, popularity, and estimated volume data. Sonar provides this with real-time API access.
Tier 2: Growth Stage (10K+ Monthly Downloads)
- Everything in Tier 1.
- Competitor tracking — monitor 3–5 direct competitors' keyword rankings and metadata changes.
- Custom Product Page analytics — Apple supports up to 35 custom product pages source: [Apple Developer Documentation], each with its own conversion rate. Track which page variants drive the best conversion for which traffic source.
- Apple Search Ads integration — connect your Search Ads data to organic ranking data. Our comparison of Apple Search Ads vs organic ASO covers when paid data informs organic strategy.
Tier 3: Enterprise (Multiple Apps, Multiple Markets)
- Everything in Tier 2.
- API-based rank tracking — automated daily pulls across hundreds of keywords and multiple countries.
- App Store Connect API integration — pull sales, download, and financial data programmatically. See our guide on App Store Connect API key scopes and automation for setup details.
- Cross-store dashboards — unified view of iOS and Android metrics in a single BI tool.
How to Audit Your Current Analytics Setup
Run this diagnostic to find gaps in your apple app store analytics coverage. For each question, a "no" answer means you have a blind spot.
| Question | If "No," You Need |
|---|---|
| Can you see your rank for each target keyword? | A keyword rank tracker |
| Do you know your conversion rate vs. category average? | App Store Connect peer group benchmarks |
| Can you identify which keywords drive downloads? | Third-party keyword analytics |
| Do you track competitor keyword movements? | Competitor monitoring tool |
| Can you correlate metadata changes to ranking shifts? | A changelog + rank history overlay |
| Do you monitor ratings velocity, not just average rating? | Ratings tracking tool or script |
| Can you compare iOS and Android keyword performance? | A cross-store analytics platform |
If you answered "no" to three or more, your analytics stack has significant gaps. The first fix is almost always adding keyword rank tracking — it is the single highest-ROI analytics addition for ASO.
For a broader view of which metrics to prioritize, our ASO KPIs guide walks through the full measurement framework.
Common Analytics Mistakes
Obsessing Over Vanity Impressions
App Store Connect's impressions metric counts every time your app icon appeared anywhere — including category browse, editorial features, and "You Might Also Like" placements. A spike in impressions with flat downloads usually means you got browse traffic, not search traffic. Search impressions are the ones that correlate with intent. Unfortunately, Apple does not separate these cleanly, which is why third-party search rank data matters.
Ignoring Seasonality in Download Data
Finance apps see 40–60% download spikes in January and April (New Year resolutions and tax season) source: [Sensor Tower State of Mobile 2025 report]. Fitness apps spike in January. If you changed your metadata in early January and downloads rose 30%, the metadata change might not be the cause — seasonality might be. Always compare year-over-year, not just week-over-week.
Treating Apple's Popularity Score as Search Volume
Apple's Search Ads popularity score is a 0–100 relative index, not a volume count. A keyword with popularity 50 does not get twice the searches of a keyword with popularity 25. The scale is logarithmic and relative to the highest-volume terms in a given country source: [Apple Search Ads documentation]. Third-party tools like Sonar translate this into estimated daily downloads at rank #1, which is a more actionable metric.
FAQ
What apple app store analytics does App Store Connect provide for free?
App Store Connect provides impressions, product page views, conversion rate, downloads, redownloads, retention metrics (Day 1, 7, and 28), and peer group benchmarks. It also reports revenue, subscription analytics, and crash data. All of these are aggregate metrics — Connect does not break any of them down by individual keyword. Source: Apple Developer Documentation.
Can I see which keywords drive my App Store downloads?
Not directly. Apple does not expose keyword-level download attribution in App Store Connect. You can see total search impressions, but not which search terms generated them. Apple Search Ads provides keyword-level data for paid campaigns, and third-party rank trackers let you correlate keyword position changes with download trends, which is the closest proxy available.
How often does the App Store re-index keyword rankings?
Apple does not publish an official re-indexing schedule. Based on observed behavior across hundreds of apps tracked through Sonar, metadata changes typically reflect in search rankings within 24–48 hours. Major changes — like a new app version with updated keywords — can take up to 72 hours. Monitoring daily with a rank tracker catches these shifts as they happen.
What is the difference between Apple's popularity score and actual search volume?
Apple's popularity score is a relative 0–100 index available through Search Ads. It reflects the relative search frequency of a keyword compared to all other keywords in that country, but it is not a raw volume count. The scale is logarithmic — the difference between popularity 40 and 50 represents far more searches than the difference between 10 and 20. Third-party analytics tools estimate actual download potential by combining this score with category benchmarks and ranking data.
How do iOS and Android app store analytics compare?
Google Play Console provides more granular search analytics than Apple — it shows the actual search terms users typed, not just aggregate impressions. Play Console also indexes the full app description (up to 4,000 characters) for search, while Apple does not index the description field at all. However, Apple's peer group benchmarks offer category-level conversion rate comparisons that Play Console lacks. Most teams need both dashboards plus a cross-store tool for a complete view.
Looking for keyword-level analytics that App Store Connect does not provide? Try Sonar free — it shows search volume estimates, difficulty scores, and competitor data for every App Store keyword.