
What Play Console Search Analytics Actually Measures (and What It Hides)
Google Play Console's search analytics report shows how users discover your app through Play Store search. It tracks three core metrics — store listing visitors from search, conversion rate per query, and search impression share — but it omits the one number most developers want: raw search volume per keyword. Understanding what play console search analytics gives you, and what it deliberately withholds, is the difference between an informed ASO strategy and guesswork dressed up as data.
Google introduced the Acquire > Store analysis section in Play Console with a significant overhaul in 2022 and has iterated on it since source: [Google Play Console Help — Analyze store performance]. As of June 2026, the report surfaces search terms that drove at least one store listing visitor, alongside metrics like conversion rate and retention benchmarks. But there are critical gaps that trip up even experienced Android developers.
The Three Metrics You Actually Get
Play Console search analytics provides three measurable data points for each keyword that drove traffic to your listing, according to Google's official documentation:
| Metric | What it measures | What it does NOT tell you |
|---|---|---|
| Store listing visitors (search) | Users who landed on your listing via a specific search term | Total search volume for that term across all apps |
| Conversion rate | Percentage of visitors from that term who installed | Whether non-converters installed a competitor instead |
| Search impression share | Your impressions as a percentage of total impressions for that term | Absolute impression count |
The search impression share metric was added later and is the closest proxy for keyword competitiveness available natively in Play Console. A 2% impression share on a high-traffic term might deliver more installs than a 40% share on a term nobody searches source: [Google Play Console Help].
Why Relative Metrics Mislead Without Context
The fundamental problem: every metric in the search analytics report is relative, not absolute. You see "500 store listing visitors from 'tip calculator'" but you have no idea whether that term gets 1,000 total searches or 100,000. A keyword sending you 500 visitors from a pool of 2,000 searches represents a 25% capture rate — strong performance. The same 500 visitors from a pool of 200,000 searches is a 0.25% capture rate — you are barely visible.
I have seen developers celebrate a "high-converting keyword" that sends 12 installs per month because its conversion rate was 80%. Twelve installs. That keyword was functionally irrelevant to their growth despite looking excellent in the Play Console dashboard.
Where Play Console Data Falls Short
Play Console's search analytics has four structural limitations that matter for ASO decisions:
- No absolute search volume. Google does not expose total queries per keyword in Play Console. This is the single largest gap. Without it, you cannot size keyword opportunities or compare keywords across categories.
- Minimum threshold filtering. Keywords that generate very few impressions for your specific app are excluded from the report entirely. If you rank at position 50 for a valuable keyword, you will likely never see it in your dashboard — precisely the keyword you most need to discover source: [Google Play Console Help — Data thresholds].
- No competitor keyword data. You can only see keywords that drove traffic to YOUR listing. You cannot see which keywords drive traffic to a competitor's listing. This makes competitive keyword research impossible from Play Console alone.
- Delayed and aggregated data. Play Console data typically reflects a 48–72 hour delay and is aggregated over 7-day or 28-day windows. Real-time keyword ranking shifts are invisible source: [Google Play Console Help].
For a broader look at what metrics matter for ASO beyond raw console data, see ASO KPIs: What to Track and Why.
How to Read Search Impression Share Correctly
Search impression share is the most misunderstood metric in play console search analytics. Google defines it as your listing's impressions for a given keyword divided by total impressions for that keyword across all apps source: [Google Play Console Help].
Here is how to interpret it correctly:
- Impression share rising + visitors flat = your rank improved but the keyword itself is losing search volume. This happens during seasonal declines.
- Impression share flat + visitors rising = the keyword is growing in popularity and your rank is stable. This is the ideal scenario — ride the wave.
- Impression share falling + visitors rising = more competitors are ranking, but overall search volume is growing fast enough to compensate. Watch this trend — it typically reverses.
- Impression share falling + visitors falling = you are losing rank. Investigate immediately. Check if a competitor updated their listing or if Google's algorithm shifted.
Cross-Referencing With External Keyword Data
Since Play Console does not provide absolute search volume, pairing it with an external ASO tool fills the gap. For example, Sonar's keyword index puts "tip calculator" at Android difficulty 22 and popularity 45, versus iOS difficulty 44 and popularity 38 — demonstrating how the same keyword shows dramatically different competitive dynamics across platforms (source: Sonar /api/v1/keywords/search, queried 2026-06-08). That popularity score tells you the term has meaningful search volume on Android, context that Play Console's relative metrics alone cannot provide.
Similarly, for "subscription tracker," Sonar reports Android difficulty 26 and popularity 24 versus iOS difficulty 41 and popularity 26 — another case where Android's lower difficulty signals an easier ranking opportunity (source: Sonar /api/v1/keywords/search, queried 2026-06-08). Without a third-party difficulty benchmark, you would have no way to assess whether a keyword surfaced in your Play Console report is easy to rank for or fiercely competitive.
To understand how keyword difficulty scores work and how to use them in your ASO workflow, see App Store Keyword Difficulty: What It Measures and How to Use It.
Turning Play Console Data Into Keyword Decisions
Play Console search analytics is a feedback loop, not a discovery tool. It tells you how you are performing on keywords you already rank for — it cannot surface keywords you should be targeting but are not yet visible for. Here is a practical framework for using the data:
Step 1: Export and Categorize Your Keywords
Download the search analytics CSV from Play Console (Acquire > Store analysis > Search tab). Sort keywords into three buckets:
| Bucket | Criteria | Action |
|---|---|---|
| Winners | Impression share > 10%, conversion rate > average | Protect these. Monitor for rank drops weekly |
| Opportunities | Impression share < 5%, conversion rate > average | You convert well but are barely visible. Prioritize ranking improvements |
| Underperformers | Impression share > 10%, conversion rate < average | You rank well but do not convert. Test listing changes |
Step 2: Identify Volume Gaps With External Tools
For every "Opportunity" keyword, check its actual search volume using an external keyword tool. A keyword with 2% impression share could be sending you 20 visitors from a pool of 1,000 — or 200 visitors from a pool of 10,000. The response is completely different.
Long-tail variants drop difficulty significantly: "tip calculator usa" shows Android difficulty 10 and popularity 12, versus the head term's difficulty 22 (source: Sonar /api/v1/keywords/search, queried 2026-06-08). If your Play Console report shows a long-tail variant converting well, the data might be telling you to double down on it with a custom store listing for that country.
Step 3: Test Listing Changes Based on Conversion Data
When Play Console shows a high-traffic keyword with below-average conversion, the listing itself is the problem — not the keyword. Test changes to your screenshots, short description, or icon using Play Store listing experiments with that keyword's visitors as the evaluation cohort.
Common Misreadings I See Developers Make
In working with Android developers using the search analytics tab, I have observed the same mistakes repeatedly:
Mistake 1: Optimizing for keywords already at maximum impression share. If you hold 35% impression share for a keyword, pushing to 40% yields diminishing returns. Your effort is better spent finding new keywords where your impression share is near zero.
Mistake 2: Ignoring branded search terms. Your own app name appearing in search analytics is not "free traffic" — it is demand you already generated through marketing. Filtering it out when evaluating organic ASO performance gives a clearer picture.
Mistake 3: Comparing conversion rates across wildly different keywords. A utility keyword like "calculator" has inherently different conversion dynamics than a niche keyword like "tip calculator usa." Comparing their conversion rates directly is meaningless — compare each keyword's conversion rate against category benchmarks instead.
Mistake 4: Treating a single week's data as a trend. Play Console data fluctuates significantly week to week, especially for keywords with lower search volume. I look at minimum 28-day windows before drawing conclusions, and I cross-reference with keyword rank tracking data to separate noise from real movement.
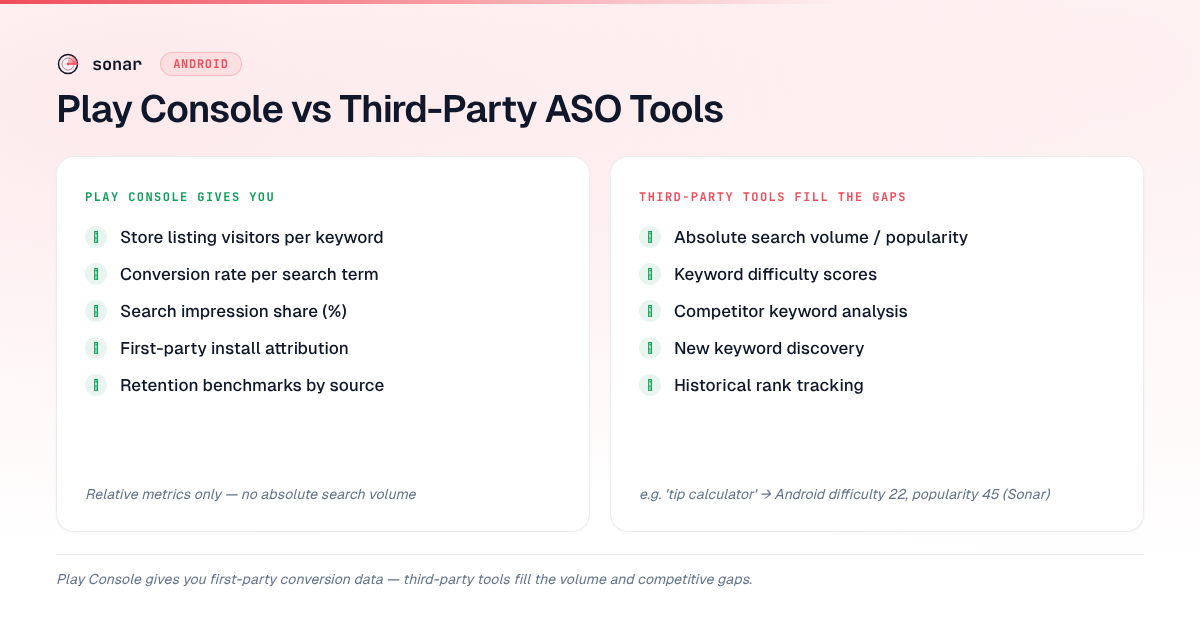
Play Console Search Analytics vs. Third-Party ASO Tools
Neither Play Console nor third-party tools give you the complete picture alone. Here is where each excels:
| Capability | Play Console | Third-party ASO tools |
|---|---|---|
| Actual visitors from search | Yes (your app only) | No |
| Conversion rate per keyword | Yes | No |
| Search impression share | Yes (your app only) | No |
| Absolute search volume / popularity | No | Yes (estimated) |
| Keyword difficulty score | No | Yes |
| Competitor keyword analysis | No | Yes |
| Keyword discovery (new terms) | Limited to terms you already rank for | Yes |
| Historical rank tracking | Limited | Yes |
The optimal workflow combines both: use third-party tools like Sonar for keyword discovery, difficulty assessment, and competitive analysis, then validate with Play Console's first-party conversion and impression share data.
For a comprehensive breakdown of how Android ASO differs from iOS, including how Play Console's data model contrasts with App Store Connect, see iOS App Store vs Google Play: How ASO Differs Between Platforms.
Connecting Play Console Data to Your Metadata Strategy
The search analytics data should directly inform what you put in your app title, short description, and long description. Google Play indexes up to 4,000 characters in the long description for search ranking purposes source: [Google Play Console Help — Store listing best practices], and the keywords surfaced in your search analytics report confirm which terms Google is matching to your listing.
When a keyword appears in your Play Console search report with low impression share but strong conversion, that is a signal to strengthen that keyword's presence in your metadata. Specifically:
- If the keyword is not in your title (limited to 30 characters on Google Play source: [Google Play Console Help — Store listing best practices]), consider adding it or a close variant.
- If it appears only in your long description, promote it to the short description (limited to 80 characters source: [Google Play Console Help — Store listing best practices]) for stronger ranking weight.
- For a detailed guide on how to structure long description keywords for maximum indexing, see Google Play Long Description: Keyword Structure.
Frequently Asked Questions
Does Play Console show actual search volume for keywords?
No. Google Play Console does not expose absolute search volume for any keyword. It shows relative metrics — store listing visitors, conversion rate, and search impression share — that are specific to your app's performance. To estimate actual search volume, you need a third-party ASO tool that maintains its own keyword index source: [Google Play Console Help].
How often does Play Console search analytics data update?
Play Console search data typically updates with a 48–72 hour delay. The reports are aggregated over 7-day or 28-day windows, selectable in the dashboard. Real-time or daily keyword ranking changes are not visible in Play Console's native reporting source: [Google Play Console Help].
What is search impression share in Play Console?
Search impression share represents your app's impressions for a given search term as a percentage of all impressions for that term across the entire Play Store. For example, a 10% impression share means your listing appeared in 10% of all instances where that keyword triggered a result. It is the closest native proxy for keyword competitiveness available in Play Console source: [Google Play Console Help].
Can I see which keywords my competitors rank for in Play Console?
No. Play Console only reports on keywords that drove traffic to your own listing. Competitor keyword analysis requires a third-party ASO tool that tracks keyword rankings across multiple apps. This is one of the most significant limitations of relying solely on Play Console for your ASO strategy.
How should I combine Play Console data with third-party keyword tools?
Use third-party tools for keyword discovery, difficulty scoring, and competitive research. Then validate those keywords against Play Console's first-party data — conversion rate and impression share — to confirm which terms actually drive installs for your specific app. The combination gives you both the breadth of discovery and the accuracy of Google's own measurement.
Want to fill the gaps that Play Console leaves open? Try Sonar free — it shows search volume, difficulty, and competitor keyword data for every Google Play keyword, so you can pair external intelligence with your first-party Play Console analytics.