What Is Product Page Optimization and How Does Apple's A/B Test Work?
Product page optimization (PPO) is Apple's native A/B testing feature inside App Store Connect. It lets you test up to 3 treatment variants against your default product page, splitting live organic traffic to measure which creative drives more downloads source: [Apple Developer Documentation — PPO]. Unlike third-party testing tools that rely on redirected traffic or simulated environments, PPO uses actual App Store visitors — the same users who find you through search, browse, or referral links.
Apple introduced PPO alongside iOS 15 in 2021 source: [Apple WWDC21 — Get ready to optimize your App Store product page]. It remains the only way to run a true split test on your default App Store listing without external tooling, and it is free for all developers in the Apple Developer Program.
PPO is distinct from Custom Product Pages, which create entirely separate listings (up to 70 per app) for different traffic sources source: [Apple Developer — Custom Product Pages]. PPO tests variants on your single default page; CPPs create additional pages for specific channels. Both matter, but they solve different problems.
What You Can Test with PPO
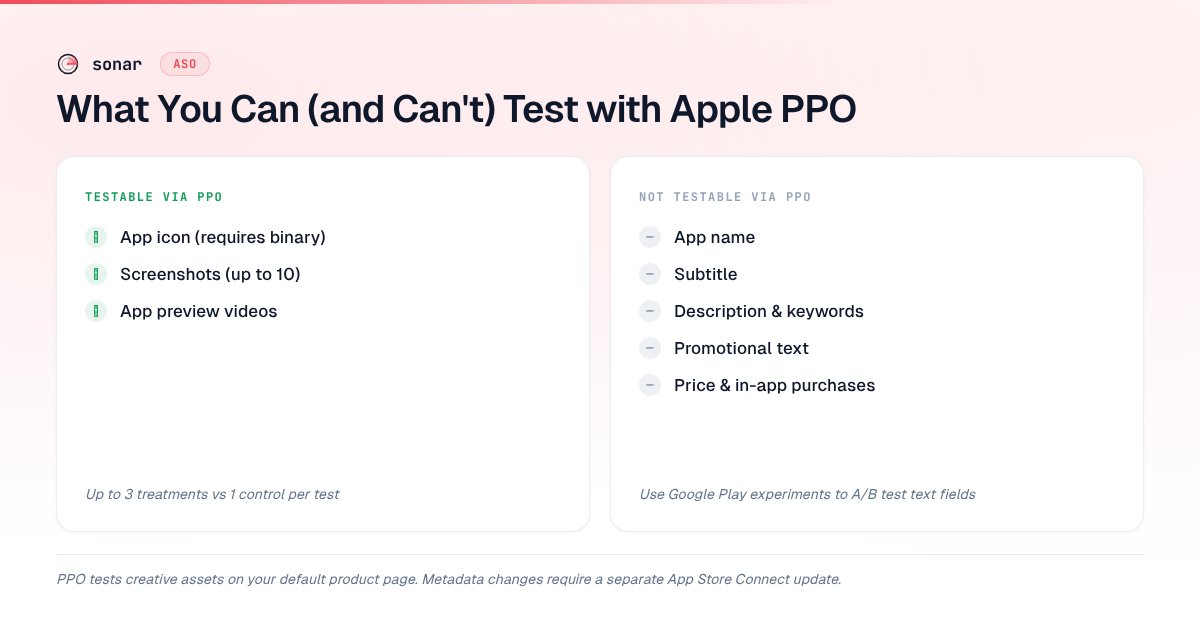
PPO restricts testing to three visual elements on your default product page. You cannot test metadata (title, subtitle, description, keywords) through PPO — only creative assets source: [Apple Developer Documentation — Product Page Optimization].
| Element | Testable via PPO? | Notes |
|---|---|---|
| App icon | Yes | Each variant can show a different icon |
| Screenshots | Yes | Different screenshot sets per variant |
| App preview videos | Yes | Different preview videos per variant |
| App name | No | Shared across all variants |
| Subtitle | No | Shared across all variants |
| Description | No | Shared across all variants |
| Keywords | No | Shared across all variants |
| Promotional text | No | Shared across all variants |
| Price / IAPs | No | Shared across all variants |
Source: Apple Developer — Configure a PPO test
The icon restriction is worth emphasizing. Testing your app icon through PPO requires submitting each icon variant as part of an app binary — icons are baked into the build, not uploaded separately like screenshots. This means icon tests require a new app submission through App Review, which adds lead time compared to screenshot-only tests source: [Apple Developer — Product Page Optimization].
How to Set Up a PPO Test Step by Step
Setting up a PPO test takes about 10 minutes of active work, plus the wait for App Review if you are testing icons. Here is the process as of 2026.
- Open App Store Connect and navigate to your app's PPO section under "Features."
- Create a new test. Give it a reference name (visible only to you) and choose which element to test: icon, screenshots, or app preview video.
- Add treatment variants. You can add up to 3 treatments that will be compared against your original (control). Each treatment needs its own creative asset(s).
- Configure the traffic split. Apple lets you allocate between 10% and 100% of traffic to the test. The remaining traffic sees your default page. A 50/50 split is common for faster results; smaller splits (e.g., 20%) reduce risk if you are worried about a variant hurting downloads.
- Choose localization(s). You can run the test in specific locales or across all of them.
- Submit for review. Screenshot and video tests go through a lightweight review. Icon tests require a full app binary submission.
- Monitor results. Apple reports improvement (or decline) relative to the control, along with a confidence interval.
Source: [Apple Developer — Run a PPO test]
One limitation I find frustrating: Apple does not publish the exact statistical methodology it uses for confidence intervals. The documentation says results are "displayed with a confidence interval" but does not specify the confidence level (90%? 95%?) or the underlying test source: [Apple Developer — View test results]. SplitMetrics' analysis of PPO results suggests Apple uses a frequentist approach with approximately 90% confidence, but this is inferred rather than confirmed source: [SplitMetrics — Apple PPO: The Complete Guide].
How Long to Run a PPO Test
Apple requires a minimum test duration of 7 days, and tests can run for a maximum of 90 days source: [Apple Developer — Product Page Optimization]. In practice, the right duration depends on your daily traffic volume.
The math is simple: you need enough impressions per variant to detect the conversion difference you care about. Apps with fewer than 1,000 daily product page views may need 4-6 weeks to detect a subtle lift. Apps with 10,000+ daily views can often get a clear signal within 7-14 days.
Here is a rough guide based on traffic volume:
| Daily product page views | Minimum test duration for detectable lift | Detectable lift (approximate) |
|---|---|---|
| Under 500 | 30-60 days | 10%+ relative change |
| 500-2,000 | 14-30 days | 5-10% relative change |
| 2,000-10,000 | 7-14 days | 3-5% relative change |
| Over 10,000 | 7 days | 2-3% relative change |
These estimates assume a 50/50 traffic split and roughly 80% statistical power. I derived them from standard sample-size formulas for two-proportion z-tests, using baseline conversion rates of 20-35% (typical iOS ranges per StoreMaven's 2024 conversion benchmarks across 1,000+ tests).
Stopping a test early because the numbers look good after 3 days is a common mistake. Short-duration results are noisy — seasonality can make a losing variant look like a winner on Monday but a loser by Friday. Let the test run its full planned duration.
What to Test First: A Priority Framework
Not all PPO tests are equal. The three testable elements — icon, screenshots, and app preview videos — differ in both their typical impact on conversion and the effort required to test them.
Screenshots: The Highest-ROI Starting Point
Screenshots are the first thing most users see when they land on your product page. Apple displays up to 10, but only the first 3 appear above the fold in search results source: [Apple Developer — App Store screenshot specifications]. StoreMaven's eye-tracking research found that 60% of users never scroll past this first impression (source: StoreMaven — How Users Interact with App Store Pages, 2023). A good screenshot caption strategy paired with a PPO test on the first 3 screenshots is the fastest path to a measurable conversion lift.
Screenshot tests also require no new app binary — you upload variants directly in App Store Connect, which means faster iteration cycles.
App Icon: High Impact, Higher Effort
Icon tests can produce dramatic swings. SplitMetrics' 2023 Mobile Growth Report found icon changes can shift conversion rates by 10-25% in either direction source: [SplitMetrics — Mobile Growth Report 2023]. But because each icon variant requires a binary submission, the feedback loop is slower. Test icons when you have a specific hypothesis — for example, "a simpler icon will stand out better in search results" — not as a fishing expedition.
App Preview Videos: Test Only If You Already Have One
App preview videos autoplay in the App Store, which gives them outsized influence on first impressions. But producing multiple video variants is expensive. If you already have a video, testing a variant with a different opening frame or value proposition is worthwhile. If you do not have a video yet, read our analysis of app preview video conversion impact before investing in production.
How PPO Interacts with Your ASO Keyword Strategy
PPO operates on conversion, not on keyword rankings or search visibility. PPO does not change your metadata — it tests only the creative layer. But conversion rate and keyword rankings are connected in a feedback loop that makes PPO indirectly relevant to your entire ASO strategy.
Here is the mechanism: when your listing converts better, more users download. Higher download velocity signals relevance to Apple's algorithm, which can improve your ranking for the keywords in your title and keyword field. A 5% relative conversion lift, compounded over weeks, translates into meaningfully higher organic rankings — which in turn drives more impressions, creating a virtuous cycle.
This effect is especially pronounced for competitive keywords. Sonar's keyword index puts "budget planner" at iOS difficulty 65, popularity 51, with 191 apps in results — a fiercely competitive category keyword where even a small conversion lift from a PPO test can swing hundreds of daily downloads (source: Sonar /api/v1/keywords/search, queried 2026-07-02). If you rank 15th for "budget planner" and a screenshot test lifts your conversion by 8%, the resulting download boost can push you into the top 10 — a position shift worth far more than the conversion lift alone.
The same principle applies across different audience segments. Sonar reports "habit tracker" at iOS difficulty 67 and popularity 58, with 189 competing apps — two different keywords, two different audiences, each deserving its own creative variant to test (source: Sonar /api/v1/keywords/search, queried 2026-07-02). A budget planner might need clean, financial-looking screenshots emphasizing simplicity, while a habit tracker audience responds to streak visuals and colorful progress charts. PPO lets you find the winning creative for the audience your keywords actually attract.
PPO vs Play Store Listing Experiments: Key Differences
If you ship on both iOS and Android, understanding how Apple's page-level A/B testing compares to Play Store listing experiments helps you allocate testing resources.
| Feature | Apple PPO | Google Play Listing Experiments |
|---|---|---|
| Max variants | 3 treatments + control | 3 variants + control (default graphics) |
| Testable elements | Icon, screenshots, preview video | Icon, screenshots, feature graphic, short description, long description |
| Text testing | Not supported | Supported (short and long description) |
| Traffic allocation | 10-100%, configurable | Automatically split |
| Minimum duration | 7 days | 7 days |
| Maximum duration | 90 days | No hard max (can run indefinitely) |
| Confidence reporting | Confidence interval (methodology undisclosed) | 90% statistical confidence threshold |
| App review required? | Yes (always for icon; lightweight for screenshots) | No (no review for any element) |
Sources: Apple Developer — Product Page Optimization, Google Play Console Help — Store Listing Experiments
The biggest practical difference: Google lets you test text (descriptions), Apple does not. If you want to test messaging, Google Play is where you prototype — then apply the winning copy to your Apple subtitle and promotional text manually.
Common PPO Mistakes and How to Avoid Them
After running and reviewing dozens of PPO tests across apps in Sonar's user base, I see the same mistakes repeatedly. Here are the ones that cost the most.
- Testing too many variables at once. If your treatment has a different icon and different screenshots, you cannot attribute the result to either change. Test one element per experiment.
- Running tests during seasonal spikes. A PPO test that starts on Black Friday or during a major feature launch will capture anomalous traffic patterns. Start tests during stable-traffic periods for cleaner data.
- Ignoring locale differences. A screenshot set that wins in the US might lose in Japan. Run locale-specific tests when your app has significant international traffic.
- Applying the winner without documenting the hypothesis. PPO results compound over time when each test builds on the previous one. Document what you tested, why you tested it, and what you learned — even when the result is flat.
- Never testing at all. Per SplitMetrics' 2024 State of App Marketing report, fewer than 25% of apps have ever run a PPO test (source: SplitMetrics — State of App Marketing 2024). If you are not testing, you are optimizing your listing based on guesswork.
The compound effect of regular testing is substantial. An app that runs 6 tests per year, each producing a modest 3-5% relative conversion lift, can end the year with a cumulative conversion rate improvement of 20-30% over its starting point (based on compound math: 1.03^6 to 1.05^6).
Frequently Asked Questions
How many variants can you test in a product page optimization test?
Apple allows up to 3 treatment variants plus your original (control) in a single PPO test, for a maximum of 4 versions running simultaneously. Each treatment can modify one creative element — icon, screenshots, or app preview video — but all treatments in a single test must modify the same element type source: [Apple Developer — Product Page Optimization].
Does product page optimization affect your App Store keyword rankings?
PPO does not directly change keyword rankings because it tests only visual assets, not metadata. However, a winning variant that improves conversion rate can indirectly boost rankings. Higher conversion leads to more downloads, and download velocity is a factor in Apple's ranking algorithm (source: Phiture — App Store Ranking Factors 2024). The effect is most pronounced for competitive keywords where small conversion differences separate neighboring positions.
Can you run a PPO test and use Custom Product Pages at the same time?
Yes. PPO tests run on your default product page, while Custom Product Pages are separate listings with their own URLs. They operate independently — a PPO test splits organic traffic on the default page, while CPPs receive traffic from specific channels (Apple Search Ads, referral links, etc.) source: [Apple Developer — Custom Product Pages]. Running both simultaneously is not only possible but recommended: test your default page with PPO and test channel-specific creative with CPPs.
How much traffic do you need to run a meaningful PPO test?
Apple does not publish a minimum traffic threshold, but practical experience suggests apps with fewer than 500 daily product page views will struggle to reach statistical significance within a reasonable timeframe (under 30 days) for anything less than a 10% relative conversion change. Apps with 2,000+ daily views can typically detect 5% relative changes within 2 weeks on a 50/50 traffic split, based on standard sample-size calculations for two-proportion tests.
What is the difference between PPO and A/B testing on Google Play?
Apple's PPO tests only visual assets (icon, screenshots, preview video) on your default listing, requires App Review for submissions, and runs for a maximum of 90 days. Google Play's listing experiments can also test text fields (short and long description), do not require review, and have no maximum duration. Google reports results at a stated 90% confidence threshold; Apple's confidence methodology is not publicly documented. For a deeper comparison, see our guide to Play Store listing experiments.
Ready to find which keywords drive your product page views — and which creative deserves a PPO test? Try Sonar free — it shows search volume, difficulty, and competitor data for every keyword in the App Store and Play Store.